What to practice
- repair an explanation or graph using explicit scoring criteria
How free-response points are earned
Section II allows 90 minutes for six questions: two long questions worth 9 points each and four short questions worth 4 points each, 34 points in all (Official AP Biology exam format). You read prompts in Bluebook but handwrite answers in a paper booklet, so practice every task here on paper (Hybrid exam instructions).
Each question has a fixed role, and the four short questions address different units and big ideas (AP Biology Course and Exam Description, exam information). The last column lists chapters whose practice includes that role.
| Q | Role | Points | What the parts ask | Practice in chapters |
|---|---|---|---|---|
| 1 | Interpreting and evaluating experimental results | 9 | describe a concept; identify methods or describe data; analyze or calculate; predict and justify | 5, 7, 10, 16 |
| 2 | The same, with graphing | 9 | describe; construct a graph (3 points) and determine a result from the data (1 point); analyze, calculate or state a null hypothesis; predict and justify | 9, 13, 18, 20 |
| 3 | Scientific investigation | 4 | describe; identify a procedure; state a null hypothesis or predict; justify | 6, 10, 13, 21 |
| 4 | Conceptual analysis | 4 | describe; explain; predict the effect of a disruption; justify | 4, 8, 12, 17 |
| 5 | Analyze a model or visual representation | 4 | describe the model; explain a relationship in it; represent a relationship; connect it to a larger principle | 5, 11, 14, 19 |
| 6 | Analyze data | 4 | describe data twice; use data to evaluate a hypothesis; connect results to a principle | 7, 9, 15, 20 |
In the 2024 and 2025 scoring guidelines, Question 2's graph earned three points (type, labels, plotting with error bars); a fourth point in that part required a determination from the data.
A scorer awards each point for a specific statement, not for a general impression of understanding. Fluent paragraphs can score little; two precise sentences can earn every point. Two competing answers to one part do not help, because the scorer cannot tell which you mean.
Turn the command verb into a creditable sentence
The verb in each part decides what earns its point. This table paraphrases the course description's task verbs.
| Verb | Earns credit | Usually does not |
|---|---|---|
| Identify | Names the item; no elaboration needed | A paragraph that never names it |
| Describe | States relevant characteristics, such as a trend with direction and values | "The data change" |
| Explain | Gives how or why, linking cause to effect through a mechanism | Restating the observation |
| Calculate | Shows the setup and gives an answer with units | A bare number |
| Predict | States the specific effect of a stated change | "It will be affected" |
| Justify | Gives the evidence or reasoning that makes a claim or prediction follow | "Because the data show it" |
| State the null hypothesis | Says the independent variable has no effect on the dependent variable, naming both | A prediction of the expected result |
| Construct | Draws the requested representation; for a graph, correct type, scale, labels and plotting | A sketch without a scale |
A four-step repair routine
- Mark the verb and its object. Which quantity, which organism, which comparison?
- List the points before writing. One line per point: what must a creditable answer contain?
- Write one or two sentences per point, labeled with the part letter.
- Audit every sentence. Ask which point it earns. Fix or delete any sentence that only repeats the prompt or answers a question that was not asked.
The demonstrations below apply this routine to drafts. Their criteria are this book's practice rubrics, not official scoring guidelines, and they are worked examples, not numbered written tasks.
Demonstration 1: repair an explanation (Units 1, 3 and 6)
Prompt. A soluble cytosolic enzyme has a lysine on its water-facing surface, far from the active site. In a mutant allele, one base substitution replaces this lysine with isoleucine. (a) Describe the property of lysine's side chain that affects its interaction with water. (b) Explain how one base substitution can replace one amino acid. (c) Predict how the substitution affects whether the enzyme stays dissolved. (d) Justify your prediction.
| Part | The point requires |
|---|---|
| a | Lysine's side chain is charged (or hydrophilic), so it is attracted to polar water molecules |
| b | The changed base alters an mRNA codon; in translation, the new codon pairs with a tRNA carrying a different amino acid |
| c | Mutant molecules are more likely to clump together and come out of solution |
| d | Isoleucine's side chain is nonpolar, and nonpolar surface regions of separate molecules cluster together in water |
Draft. (a) Lysine's side chain is charged, so it is attracted to water. (b) The mutation changes the DNA, which changes the protein. (c) The enzyme will stop working. (d) Mutations damage proteins.
Scoring. Part (a) earns its point. Part (b) restates the prompt without the codon or tRNA. Part (c) predicts activity, but the question asked about staying dissolved, and the site is far from the active site. Part (d) is not a justification: many missense mutations leave function unchanged (NHGRI, missense mutation). The draft scores 1 of 4.
Repair. (b) The substitution changes one codon in the mRNA transcribed from this gene, from AAA to AUA, the only one-base change that turns a lysine codon into an isoleucine codon. During translation, AUA pairs with a tRNA that carries isoleucine, so isoleucine occupies lysine's position. (c) Mutant enzyme molecules will be more likely to clump together and leave solution. (d) Isoleucine's side chain is nonpolar, so it cannot attract water as lysine's charged side chain did. Soluble proteins usually keep hydrophilic side chains on their surfaces, while nonpolar regions cluster away from water, so a nonpolar surface patch can bind patches on neighboring molecules. In sickle cell disease, one such substitution makes hemoglobin molecules link into long fibers (OpenStax Biology 2e, protein structure).
A defensible prediction gives a direction and a mechanism, not a promised size; one substitution may change solubility only slightly.
Demonstration 2: repair a graph (Unit 4)
A student hypothesized that compound K, a fictional plant growth regulator, pushes more root-tip cells past the G1 checkpoint and into division (OpenStax Biology 2e, control of the cell cycle). Each onion root grew alone in a vial for 24 hours; five vials were randomly assigned to each concentration. In each root tip, 200 cells were classified, and the mitotic index, the percentage of cells in mitosis, was calculated per root.
| Compound K (µmol/L) | 0 | 5 | 10 | 20 | 40 |
|---|---|---|---|---|---|
| Mitotic index, mean ± 2 SE (%) | 8.0 ± 0.7 | 10.6 ± 0.6 | 13.0 ± 0.7 | 15.2 ± 0.5 | 15.5 ± 0.7 |
Table 22.1. Hypothetical data for practice; n = 5 roots per concentration.
The task: graph the means with error bars, then determine which concentrations' means cannot be distinguished from the 20 µmol/L mean.
| Point | Criterion |
|---|---|
| 1 | Type and scale: means plotted as points on a numerical x-axis spaced in proportion to concentration; joining segments acceptable |
| 2 | Plotting: all five means and their ±2 SE bars within half a grid square of the table values |
| 3 | Labels: each axis names its variable and units, and the error bars are identified |
| 4 | Determination: only 40 µmol/L, with a stated reason |
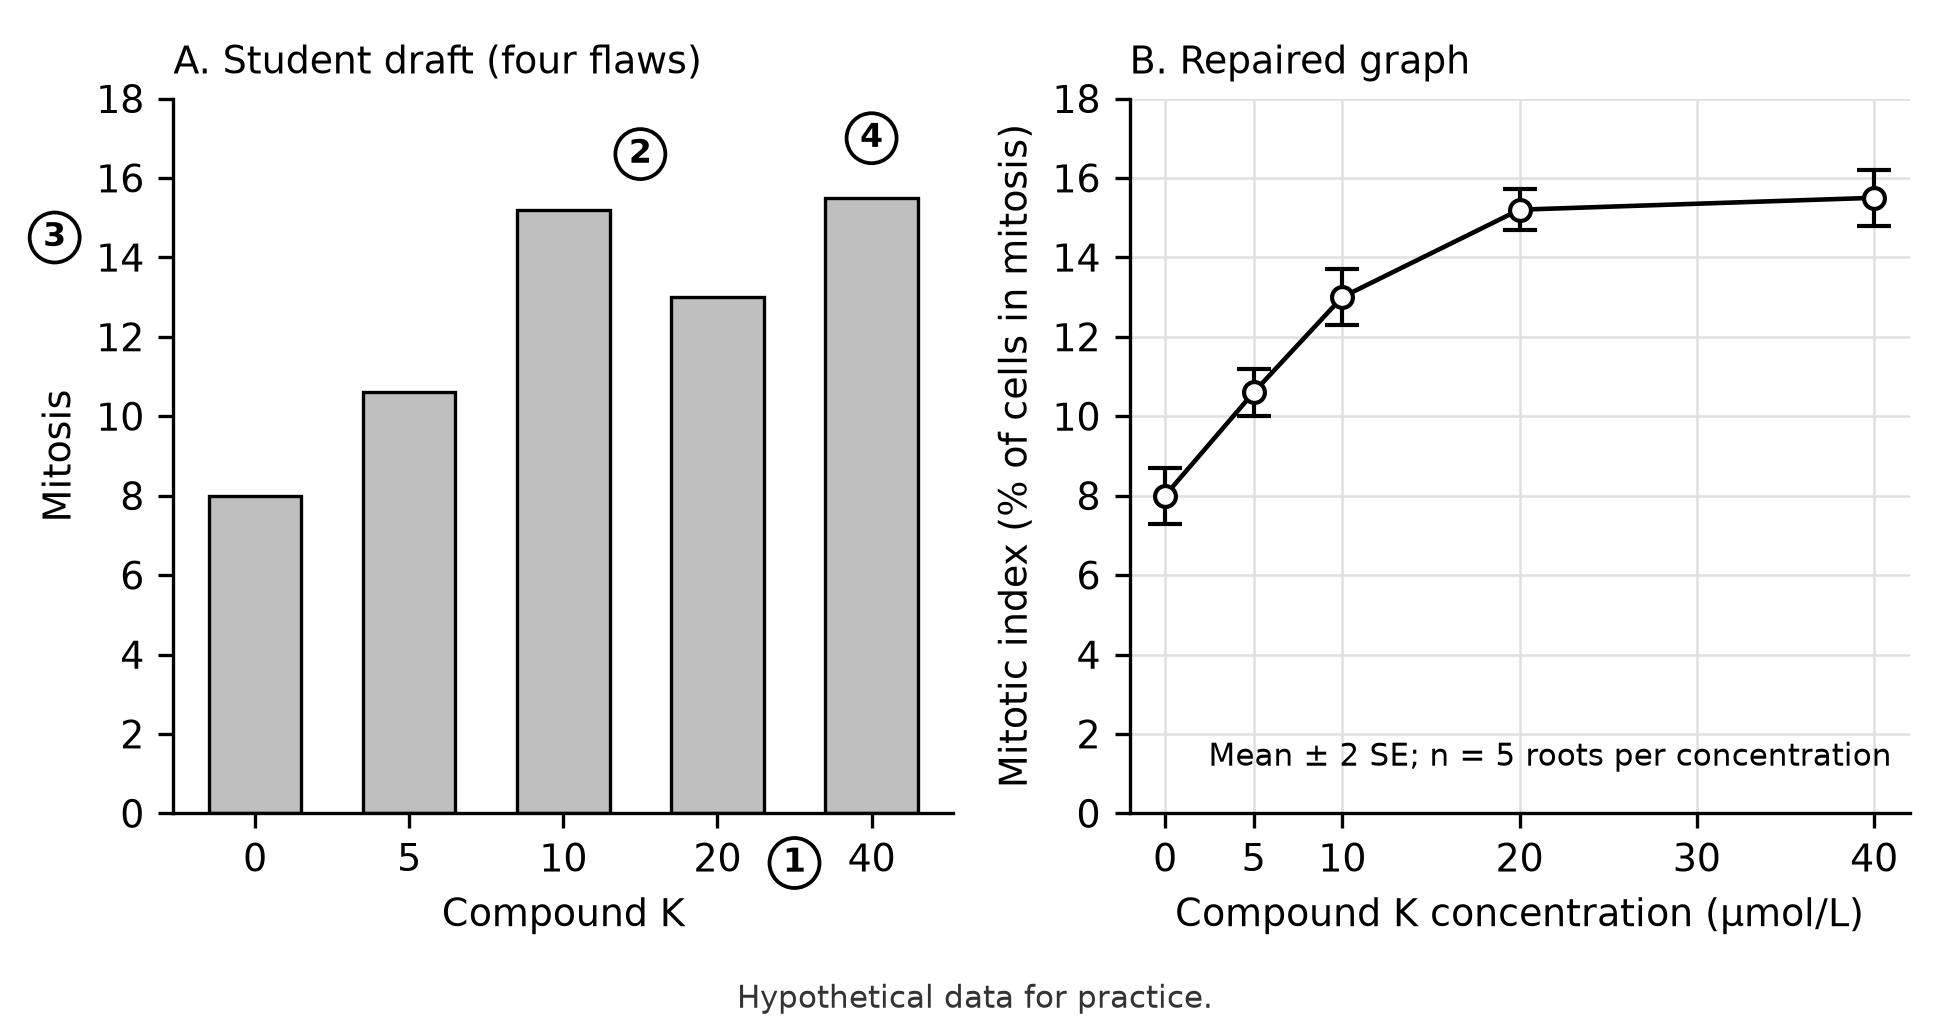
Figure 22.1. A draft graph with four flaws (A) and its repair (B), drawn from Table 22.1.
Scoring the draft. Flaw 1 loses point 1: concentration is continuous, and evenly spaced bars make the step from 20 to 40 look like the step from 0 to 5, hiding where the response levels off. Flaw 2 loses point 2: swapped values are caught only by checking each plotted value against the table. Flaws 3 and 4 lose point 3: "Mitosis" names neither quantity nor units, and missing error bars also block point 2. The draft earns none of the three construction points.
The determination. With ±2 SE bars, non-overlap gives good evidence that two means differ; overlap leaves the difference unresolved (Chapter 3). The 20 µmol/L interval, 14.7–15.7 percent, overlaps only the 40 µmol/L interval, 14.8–16.2 percent. Every other interval lies entirely below 14.7.
From graph to defensible claim. This original model response separates the claim, its evidence, its mechanism and its limit:
Raising compound K from 0 to 20 µmol/L increased the mean mitotic index from 8.0 to 15.2 percent, with no evidence of a further increase at 40 µmol/L. This fits the hypothesis that K moves more cells past the G1 checkpoint. However, the index would also rise if cells spent longer in mitosis, for example if K delayed passage through the M checkpoint, where spindle attachment is checked. Measuring root growth, or the share of mitotic cells in each stage, could separate faster cycling from slower mitosis.
The limit matters: a mitotic index is a snapshot of the fraction dividing, not a rate of division.
Demonstration 3: repair an investigation design (Units 5 and 8)
Prompt. A student asks whether rearing temperature affects adult body size in a water flea. Females of this crustacean can reproduce asexually, so one clone supplies genetically identical newborns (Ebert, Daphnia as a model system, EvoDevo, 2022). The student writes: "Put 20 newborns in one tank at 15 °C and 20 in another tank at 25 °C. Measure them on day 10. The 15 °C tank is the control. Null hypothesis: the warm fleas will be smaller." Identify two design flaws, repair the procedure, state the null hypothesis, and justify using one clone.
Diagnosis.
- One tank per temperature. Temperature was applied tank by tank, so the tank is the experimental unit and n = 1 per group; any other tank difference, such as light or crowding, is confounded with temperature. Repair: rear each newborn in its own randomly assigned jar, spread across several independently controlled water baths per temperature. One incubator holding every warm jar would still be a single unit.
- A fixed measurement day. Development is usually faster in warmer water, so on day 10 the groups may be at different life stages. Measure each flea at the same stage, such as release of its first brood.
- "Control." Both temperatures are treatments; the label rules out nothing. Instead, name controlled variables: food per flea, water volume, light cycle, and newborns from mothers kept under identical conditions.
- The null hypothesis. The draft stated a prediction. Repair: "Rearing temperature has no effect on mean body length at first reproduction in this clone."
Justification. All the fleas share one genotype, so a size difference between properly replicated temperature groups can be attributed to environment, not genotype.
Demonstration 4: repair a claim from data (Unit 7, with Units 5 and 8)
Shell thickness was measured in a fictional shoreline snail on 50 randomly collected adults before a shell-crushing crab arrived, and on 50 adults collected 12 years later. Mean ± 2 SE: 1.20 ± 0.04 mm before; 1.47 ± 0.05 mm after. Hypothetical data for practice.
Draft claim. "The snails grew thicker shells because they needed protection from the crabs. This proves natural selection."
Repair, point by point.
- Describe with values. Mean thickness rose by 0.27 mm, from 1.20 to 1.47 mm. The intervals, 1.16–1.24 and 1.42–1.52 mm, do not overlap, so the data give good evidence that the population mean changed.
- Calculate. Percent change = (1.47 − 1.20) ÷ 1.20 × 100 = 22.5 percent.
- Remove need. Selection does not answer a need. It acts on variation that already exists: if thickness varied heritably before the crabs arrived, thicker-shelled snails were more likely to survive attacks and reproduce, so alleles associated with thicker shells increased in frequency.
- State the limit. "Proves" overreaches. In some snail species, individuals thicken their shells within their own lifetime when exposed to chemical cues from crabs (Trussell and Smith, PNAS, 2000). These field data cannot separate selection from this plasticity. Rearing juveniles in identical tanks, half with water that has held crabs, would test for plasticity; resemblance among families raised without cues would indicate a heritable component. Both can operate together.
Repaired claim. "Mean shell thickness increased 22.5 percent after the crab arrived. Selection on heritable variation could explain this increase, but so could crab-induced thickening within individuals; these data alone cannot distinguish the two."
Try it
Try it 22.1 (Unit 2). Prompt: "Explain why the contractile vacuole of a freshwater protist expels water faster in pond water than in a dilute salt solution that is still hypotonic to its cytoplasm." Criterion 1: water enters the cell by osmosis because the outside water potential is higher than the cytoplasm's. Criterion 2: in the salt solution the difference is smaller, so water enters more slowly and less must be expelled. Draft: "Salt sucks water out of the cell, so the cell shrinks and the vacuole doesn't need to work." Score the draft, then write a two-sentence repair.
Try it 22.2 (Unit 8). Litter bags each held 10.0 g of dried leaves. Mesh size controlled which decomposers could enter. Eight bags per treatment were placed at randomly chosen points in one forest plot for 8 weeks.
| Decomposer access | Microbes only | Microbes + small animals | All decomposers |
|---|---|---|---|
| Dry mass lost, mean ± 2 SE (%) | 18.2 ± 1.9 | 20.0 ± 2.0 | 31.5 ± 2.3 |
Table 22.2. Hypothetical data for practice; n = 8 bags per treatment.
(a) On the grid in Figure 22.2, construct an appropriately labeled graph. Apply Demonstration 2's three construction criteria, choosing the graph type that suits these variables. (b) Determine which treatment means differ. (c) An investigator claims that small soil animals speed decomposition. Evaluate the claim using the data. (d) Identify one way the mesh itself, rather than animal access, could change mass loss, and propose an added treatment.

Figure 22.2. Graphing grid for Try it 22.2. Draw and label your own axes, scale and key.
Try it 22.3 (Unit 3). A model of the inner mitochondrial membrane in a respiring cell shows electron transport proteins, a high H⁺ concentration in the intermembrane space and ATP synthase spanning the membrane. A student describes it: "ATP synthase uses ATP to pump protons into the intermembrane space, and the electron transport chain makes ATP." (a) Identify both errors and rewrite the description. (b) Dinitrophenol (DNP) makes the inner membrane leaky to protons. Predict its effect on ATP synthesis and on oxygen consumption, and justify each prediction.
Check your try-it work
22.1. The draft earns 0 points. The solution is still hypotonic, so water still enters the cell, only more slowly; nothing pulls water out and the cell does not shrink. Repair: "Pond water has a higher water potential than the cytoplasm, so water continually enters the protist by osmosis, and the contractile vacuole pumps it out to keep the cell from bursting. In the dilute salt solution the water-potential difference is smaller, so water enters more slowly and the vacuole expels less" (OpenStax Biology 2e, osmoregulation in protists).
22.2. (a) The treatments are categories, so use a bar graph (or dot plot) of the means with ±2 SE bars. Label the y-axis with the quantity and units, name each treatment, and identify the error bars, as in Figure 22.3.
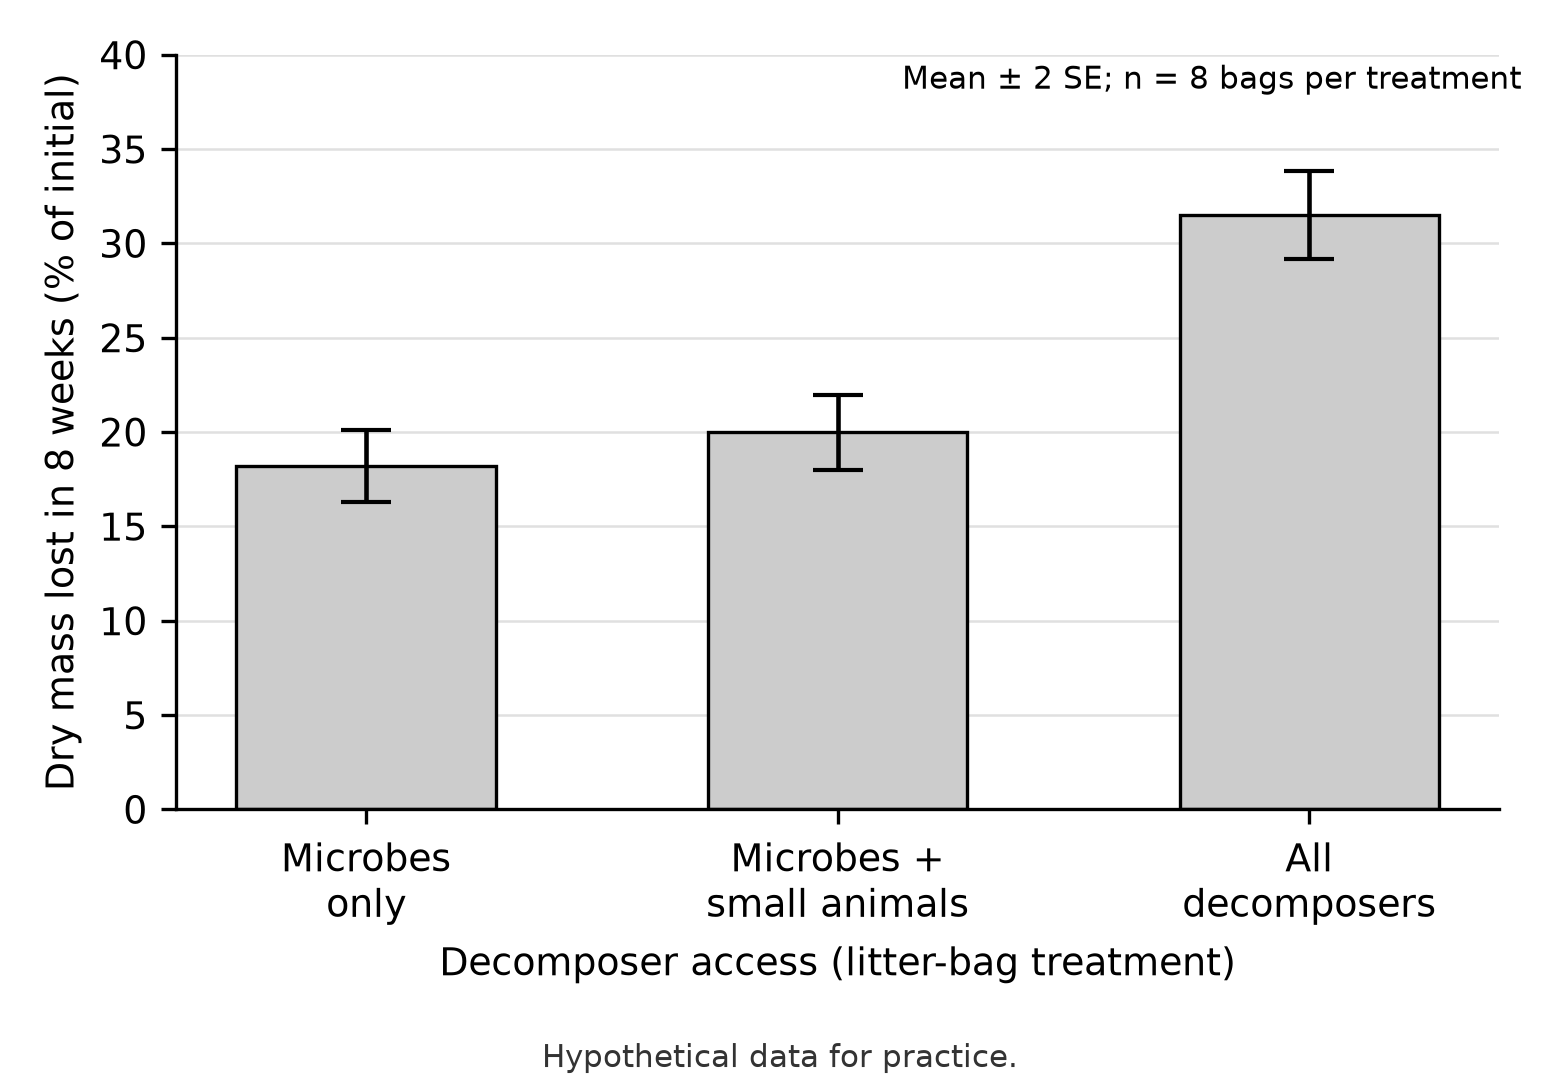
Figure 22.3. A model graph for Try it 22.2(a).
(b) The all-decomposer interval, 29.2–33.8 percent, lies above both others, so that mean differs from each. The other two intervals, 16.3–20.1 and 18.0–22.0, overlap, so those means are not shown to differ. (c) The data do not support the claim: adding small animals produced no distinguishable change. Only full access raised mass loss, from 18.2 to 31.5 percent of initial mass relative to microbes only, which is consistent with an effect of larger animals; part (d) gives a rival explanation. (d) Coarser mesh can change moisture inside the bag or let leaf fragments fall out, which would be recorded as decomposition. Mesh comparisons share this known weakness (Kampichler and Bruckner, Biological Reviews, 2009). Added treatment: coarse-mesh bags with fine mesh across the bottom, so animals can enter from above while fragments cannot fall out; or measure moisture in every bag.
22.3. (a) The roles were reversed. Electron transport proteins use energy released as electrons pass along the chain to pump H⁺ from the matrix into the intermembrane space. H⁺ then flows back down its gradient through ATP synthase, which uses that flow to make ATP from ADP and phosphate. (b) ATP synthesis falls, because protons leak back across the membrane without passing through ATP synthase, so the gradient that drives it collapses. Oxygen consumption continues, and typically increases, because DNP does not block electron transport to oxygen; pumping simply no longer builds a steep gradient. The energy is released as heat instead of being captured in ATP (OpenStax Biology 2e, oxidative phosphorylation).
Practice
This chapter adds no numbered bank questions. Its practice is Try it 22.1 to 22.3, with solutions in Check your try-it work above. Then revisit one free-response question for each role in a chapter listed in the first table: write a fresh answer on paper before rereading its sample response, score it with its printed rubric, write one repaired sentence per lost point, and log each error by Chapter 1's types. In one week, rewrite Demonstration 4's repaired claim from memory and redraw Figure 22.1B from Table 22.1 without looking. Then take Practice Exam A in Chapter 23 under timed conditions, using Chapter 1's pacing.