What to practice
- interpret a rate curve and the consequence of a changed condition
Before you read. From memory, list the interactions between R groups that hold a folded protein in its shape (Chapter 5). Predict which of them heat or a change in pH would disrupt first. You will need the list later in this chapter, which covers AP Biology topics 3.1 to 3.3.
Enzymes lower the barrier, not the destination
Even a reaction that releases free energy must first pass through an unstable transition state, and reaching that state takes an input of energy called the activation energy. An enzyme speeds a reaction by lowering this barrier. It binds the substrate and holds it in a position, or a chemical environment, that makes the transition state easier to reach (OpenStax Biology 2e, Potential, kinetic, free and activation energy).
The enzyme does not change where the reaction ends. Reactants and products have the same free energy with or without it, so the free-energy change (ΔG) is unchanged, and an enzyme cannot make an energy-requiring reaction spontaneous (OpenStax Biology 2e, Enzymes). It lowers the barrier in both directions and is not used up.
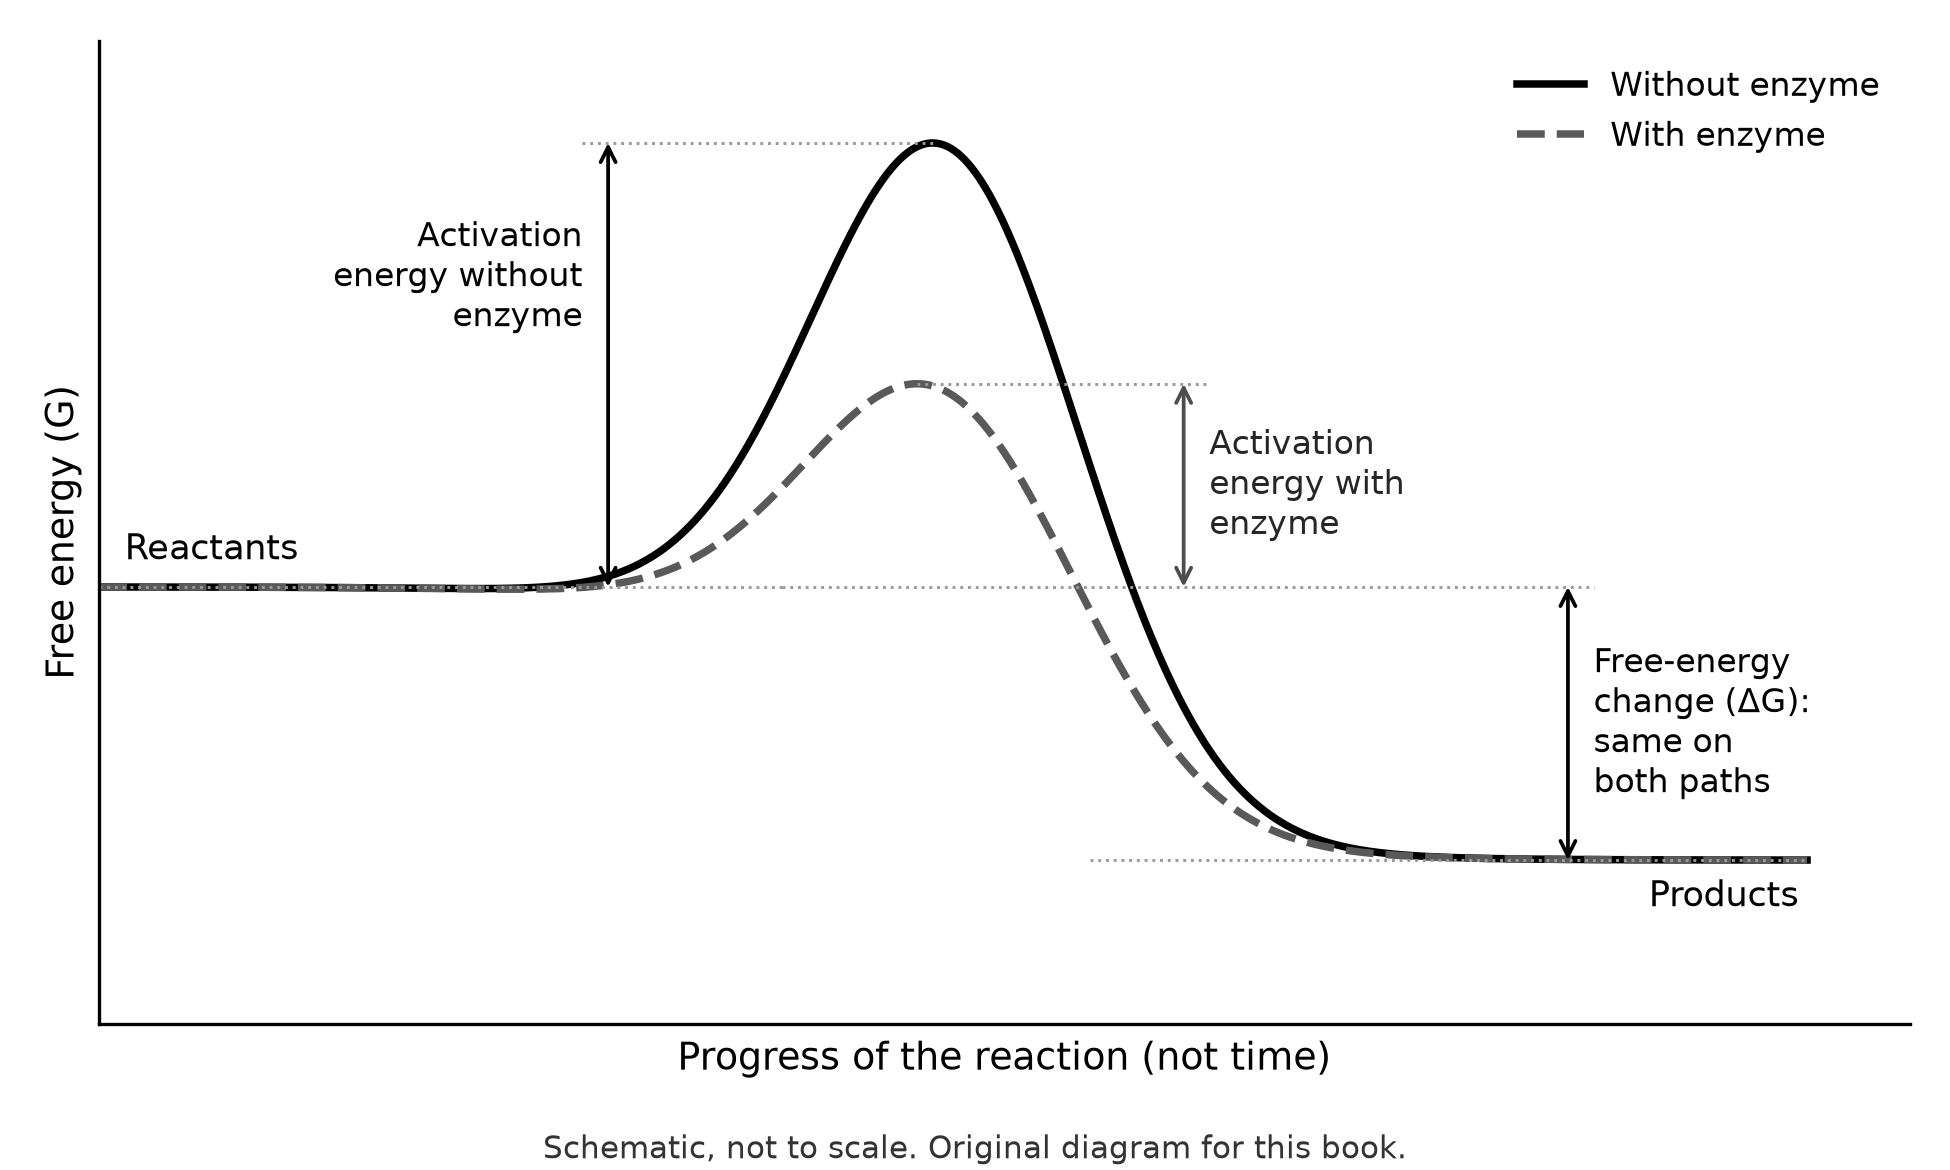
Figure 8.1. Free-energy profile of one exergonic reaction with and without an enzyme. Original schematic, not to scale.
Worked example: read a reaction-energy diagram
- Compare the ends. In Figure 8.1 the products sit lower than the reactants, so the reaction releases free energy: it is exergonic and ΔG is negative.
- Measure the barrier from the start. Activation energy runs from the reactant level up to the top of the hump, not from zero or from the product level. The catalyzed hump is lower, so its activation energy is smaller.
- Check what did not change. Both curves start and end at the same levels, so ΔG is the same on both paths. The enzyme supplies no energy; molecules cross the lowered barrier using their own motion.
Try it 8.1. On one diagram, reactants sit at 50 energy units and products at 20 units. Without the enzyme the activation energy is 40 units; with it, 15 units. (a) Find the height of each peak. (b) Find ΔG on each path. (c) Find the activation energy of the reverse reaction, with and without the enzyme.
Shape and charge decide what binds
The active site is a pocket formed by a few amino acids that the folded chain brings together. A substrate binds only if its shape and chemical character are compatible: nonpolar regions meet nonpolar R groups, and charged groups meet oppositely charged or polar ones. Binding forms an enzyme–substrate complex, and the active site shifts slightly to fit the substrate more closely, a process called induced fit (OpenStax Biology 2e, Enzymes).
This compatibility explains specificity and predicts the effect of a mutation. A substitution far from the active site may change nothing; one that puts a charged R group in a nonpolar pocket, or that alters the fold, can weaken binding. Ask two questions about any change: does it alter the active site's shape, and does it alter the chemistry of the surfaces that touch the substrate?
Environment changes rate: temperature, pH and concentration
Each factor here works by one of two routes: it changes how often enzyme and substrate meet, or it changes the shape of the active site.
Temperature. Below the optimum, warming makes molecules move faster, so enzyme and substrate collide more often and the rate rises. Above the optimum, heat disrupts the weak interactions that hold the protein's shape, and the enzyme is denatured (OpenStax Biology 2e, Enzymes).
pH. Hydrogen ion concentration changes the charges on R groups, in the active site and in the interactions that hold the fold together. Each enzyme works best in a particular pH range, and extreme pH can denature it. Denaturation is sometimes reversible: if the cause is removed, some proteins refold and regain function. Other denaturation is permanent (OpenStax Biology 2e, Proteins).
Substrate and product concentration. With a fixed amount of enzyme, adding substrate raises the rate until nearly every active site is busy; past that point, more substrate cannot help. As product accumulates, the net forward rate falls, and a reversible reaction can run backward.
Inhibitors. An inhibitor reduces activity by binding the enzyme. Table 8.1 compares the two kinds you need.
| Feature | Competitive inhibitor | Noncompetitive inhibitor |
|---|---|---|
| Where it binds | The active site, reversibly | An allosteric site, away from the active site |
| How it lowers activity | Occupies the active site, so substrate cannot bind | Changes the enzyme's shape, so the active site works poorly |
| Effect of adding much more substrate | Overcomes much of the inhibition, because substrate outcompetes the inhibitor | Does not restore the maximum rate |
Table 8.1. Two ways inhibitors reduce enzyme activity. Summarized from OpenStax Biology 2e, Enzymes.
Worked example: calculate an initial rate and judge a recovery test
A student tests one enzyme in three tubes, each starting with 20 µmol of substrate and the same amount of enzyme. Tube A is assayed at 30 °C and tube B at 50 °C. Tube C's enzyme is first held for 10 minutes at 50 °C without substrate, then cooled and assayed at 30 °C.
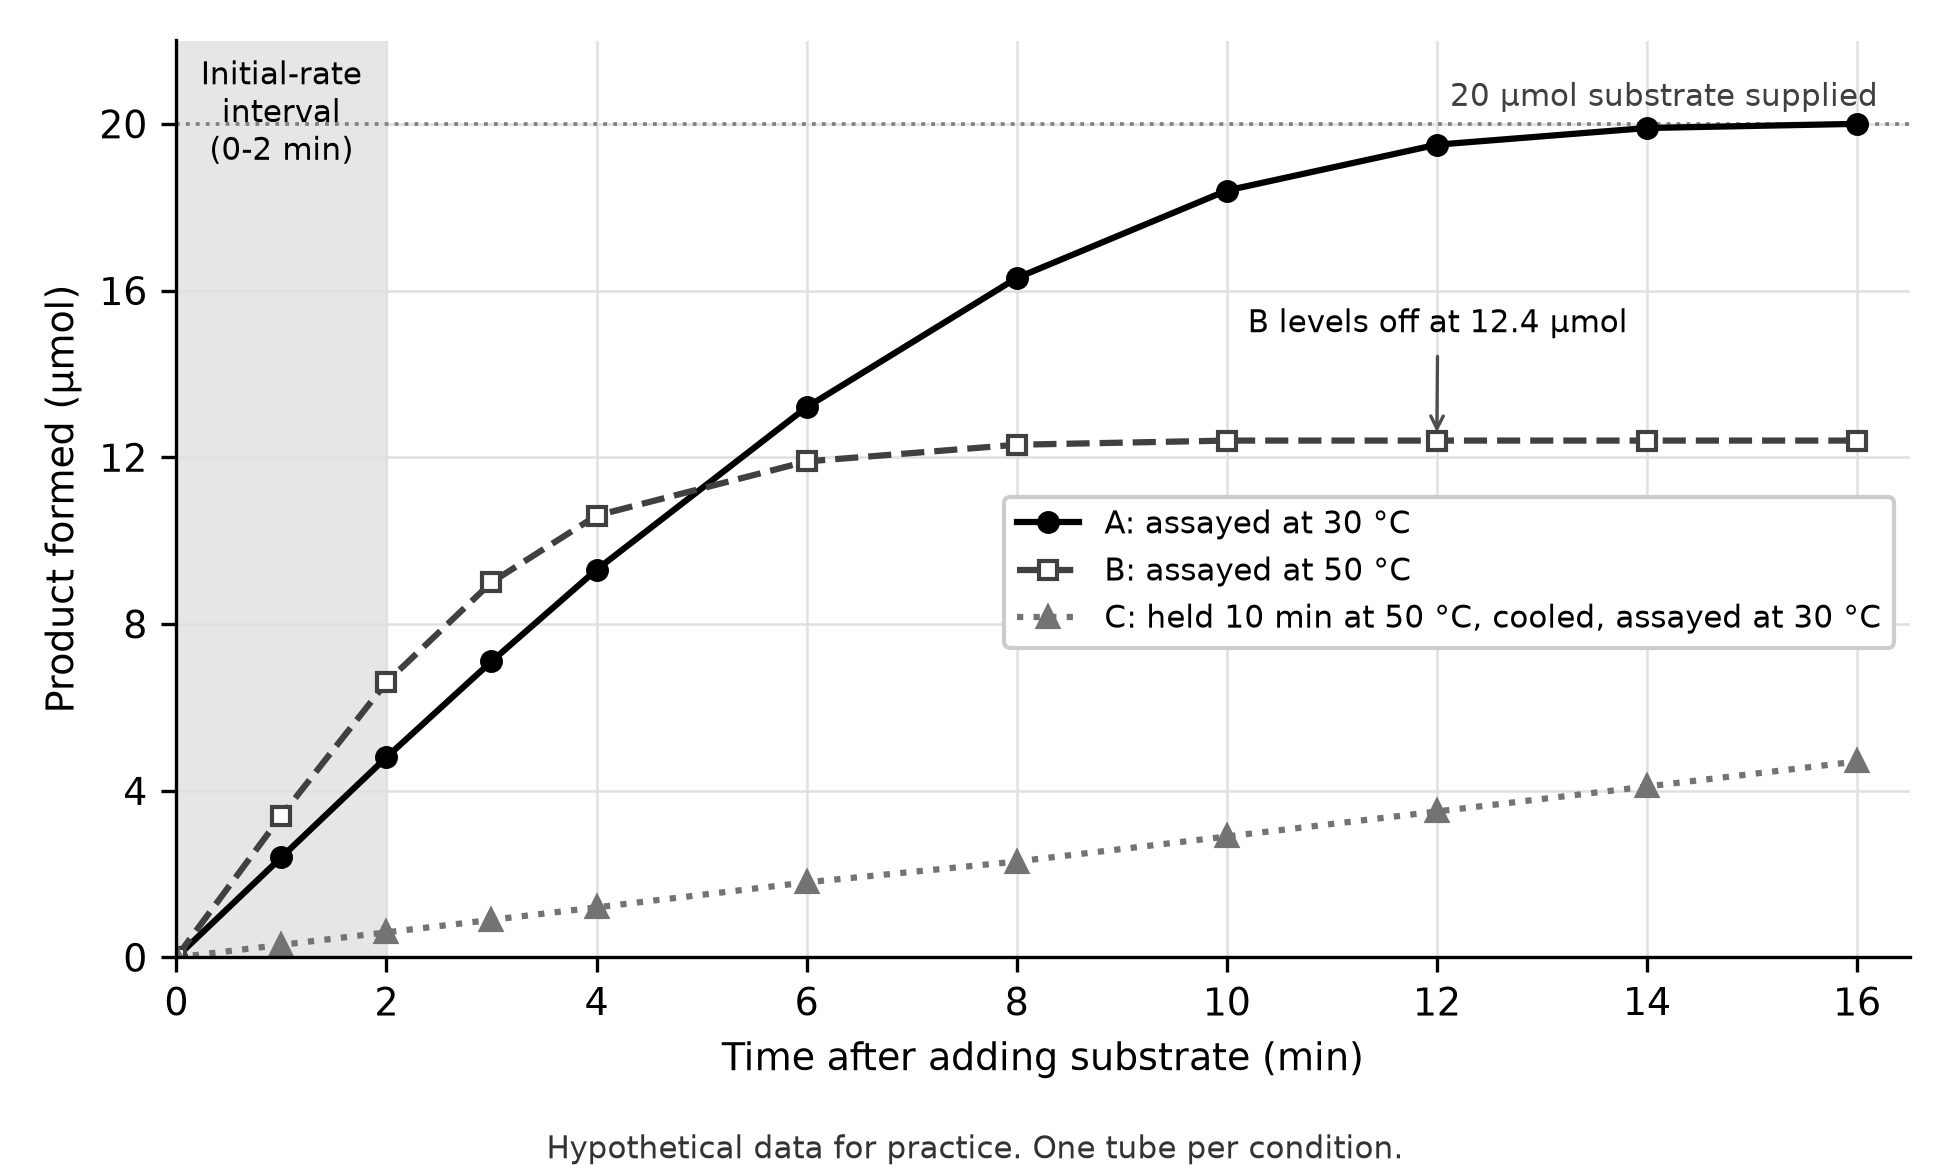
Figure 8.2. Product formed over 16 minutes. At 2 minutes: A 4.8, B 6.6 and C 0.6 µmol. A reaches 20.0 µmol at 16 minutes; B holds at 12.4 µmol from 10 minutes; C reaches 4.7 µmol. Hypothetical data for practice, one tube per condition.
Step 1: use the initial rate. Early on, substrate is plentiful, so the slope reflects enzyme activity. Over 0 to 2 minutes, A = 4.8 ÷ 2 = 2.4 µmol/min, B = 6.6 ÷ 2 = 3.3 µmol/min and C = 0.6 ÷ 2 = 0.3 µmol/min.
Step 2: explain each plateau separately. A levels off at 20.0 µmol because all the substrate has been converted: it ran out of substrate, not activity. B stops at 12.4 µmol, leaving 20 − 12.4 = 7.6 µmol unconverted, so substrate supply did not stop it. The likeliest explanation is that the enzyme was inactivated at 50 °C while it worked. B starts faster than A because collisions are more frequent at the higher temperature, but it cannot finish.
Step 3: judge the recovery test. If heat had only slowed the enzyme while it was hot, tube C would match A once assayed at 30 °C. Instead C's initial rate is 0.3 ÷ 2.4 = 0.125, or 12.5% of A's. Most of the activity lost at 50 °C did not return after cooling, at least within 16 minutes.
Step 4: state the limits. The data show a lasting loss of activity, not which interactions changed or whether activity would return later. With one tube per condition, variability is unknown; repeat each condition before concluding.
Try it 8.2. Use Figure 8.2. (a) Calculate C's average rate over 0 to 16 minutes. (b) A classmate says tube A stopped because its enzyme wore out. Use the data to refute this. (c) Propose one added tube that would test whether heat damage at 50 °C depends on the absence of substrate.
Pathways and feedback control the flow
Most cell products come from a sequence in which the product of one enzyme becomes the substrate of the next: A → B → C → D. Slowing an early step slows everything downstream. Sequential pathways also transfer energy in small, controlled steps rather than all at once.
Cells use this arrangement for control. In feedback inhibition, a pathway's end product binds an allosteric site on an enzyme near the start of the pathway and reduces its activity. When the product is plentiful, the pathway slows; when it is used up, the product leaves the enzyme and the pathway speeds up (OpenStax Biology 2e, Enzymes). H. Edwin Umbarger reported early evidence for this control in 1956, in the bacterial pathway that makes isoleucine (Umbarger, 1956, Science). Feedback inhibition keeps a cell from spending energy and materials on a product it does not need.
Try it 8.3. In the pathway A → B → C → D, enzyme 1 converts A to B, and D inhibits enzyme 1 at an allosteric site. (a) Predict how a large supply of D affects the rate at which A is used. (b) Explain why inhibiting the first enzyme is more economical than inhibiting the last one.
Living systems need an energy input
Every energy transfer loses some energy as heat, and the entropy, or disorder, of the universe increases (OpenStax Biology 2e, The laws of thermodynamics). A cell stays highly ordered only by taking in energy continuously and releasing heat and simpler molecules to its surroundings. A cell that loses its energy supply cannot maintain its order and dies.
Exergonic reactions release free energy and can proceed on their own. Endergonic reactions, such as building a protein from amino acids or pumping ions against a gradient, require free energy and cannot.
Coupling: ATP pays for uphill work
ATP hydrolysis releases free energy. In energy coupling, the cell links that release to an endergonic process, often by transferring ATP's terminal phosphate to another molecule. The phosphorylated molecule is less stable, so the next step can proceed. In the sodium–potassium pump, a phosphate from ATP attaches to the pump protein and changes its shape (OpenStax Biology 2e, ATP: adenosine triphosphate). The combined process must be exergonic: the energy released has to exceed the energy required.
Worked example: is coupling a sufficient explanation?
Claim: "The reaction X + Y → XY requires free energy, so a cell cannot make XY."
- Name the requirement. The reaction is endergonic, so it will not proceed alone.
- Look for a coupled step. If the cell transfers a phosphate from ATP to X, then X–P + Y → XY + Pᵢ can proceed, because the combined change releases free energy.
- Ask what would show coupling. The strongest evidence is a phosphorylated intermediate, together with ATP use that rises and falls with XY production. The mere presence of ATP is not evidence.
Verdict: the claim is wrong. Cells make the products of endergonic reactions by coupling them to exergonic ones such as ATP hydrolysis.
Shared pathways point to shared ancestry
Nearly all living organisms carry out glycolysis (OpenStax Biology 2e, Glycolysis), and glycolysis and oxidative phosphorylation occur, in some form, in all three domains: Archaea, Bacteria and Eukarya. The best explanation for so many organisms sharing the same complex sequence of steps is inheritance from a common ancestor (AP Biology Course and Exam Description). The strongest evidence is molecular: similar enzyme or gene sequences catalyzing the same steps in distantly related organisms.
Common errors to repair
- "Enzymes supply energy." They lower activation energy; ΔG is unchanged and the enzyme is not consumed.
- "Activation energy is the peak height." It is the peak's height above the reactants.
- "A plateau means the enzyme stopped." First check whether the substrate ran out.
- "A competitive inhibitor changes the enzyme's shape." It occupies the active site; an allosteric inhibitor changes the shape.
- "Cooling always restores a heated enzyme." Only some denaturation is reversible; test it with a recovery assay.
Check your try-it work
8.1. (a) The uncatalyzed peak is 50 + 40 = 90 units; the catalyzed peak is 50 + 15 = 65 units. (b) ΔG = 20 − 50 = −30 units on both paths. (c) Reverse activation energy is 90 − 20 = 70 units without the enzyme and 65 − 20 = 45 units with it. Both barriers fall by 25 units, so the enzyme speeds both directions.
8.2. (a) 4.7 ÷ 16 ≈ 0.29 µmol/min. (b) A stopped at 20.0 µmol, exactly the substrate supplied, so it ran out of substrate; adding more substrate would restart product formation. (c) Hold enzyme for 10 minutes at 50 °C with substrate present, then cool it and assay it at 30 °C with fresh substrate. Compare its initial rate with C's.
8.3. (a) The rate falls, because D binds enzyme 1 and reduces its activity. (b) Blocking the first step stops the whole pathway, so the cell does not spend energy and materials making B and C that it cannot use.
Practice
The printed practice for this chapter is Questions 83–94 and Written task 7, in that order after this chapter's companion panel. Questions 83–86 share one data table, and Questions 87 and 88 share one energy diagram. Answers, reasoning, the error in each wrong choice and a Repair and retry line are in Answers, explanations and written responses at the back of the book, under Chapter 8: answers and explanations. One week later, redo every item you missed without notes.