What to practice
- explain selection from heritable variation and differential reproduction
Spray a mosquito population every season and within a few years many larvae survive a dose that once killed nearly all of them. No mosquito decided to resist, and the spray did not create the resistance. This chapter explains how natural selection produces that kind of change and how to argue it from evidence. It covers topics 7.1 to 7.3 and 7.8. The skill to build is an explanation that names heritable variation and differential reproduction, and a habit of asking whether data show a change in a population across generations or only a change within individuals. Numbers are hypothetical data for practice unless a source is named.
Retrieve first. From Chapter 16: list three causes of mutation. Does an environment produce the particular mutations its organisms need? The answer is in Check your try-it work.
Natural selection in four links
An explanation of natural selection needs four links (UC Berkeley Understanding Evolution, Natural selection).
- Variation. Individuals in a population differ in traits.
- Heredity. Some of that variation is heritable: it is passed to offspring through genes.
- Differential reproduction. More offspring are produced than the environment can support. Competition for resources, predators and disease mean that, in a given environment, individuals with some heritable traits survive and reproduce more than others.
- Change across generations. Heritable traits that improved reproduction become more common in the next generation.
Individuals do not evolve; populations do. A body can change during a lifetime, as muscles grow with use, but such acquired changes are not inherited.
Worked example 17.1: one season of predation
Crabs crush thin-shelled snails more easily than thick-shelled ones. A biologist measured shell thickness in one tide-pool population before the predation season, among the survivors that bred, and in their offspring once grown in the same pools (Figure 17.1).
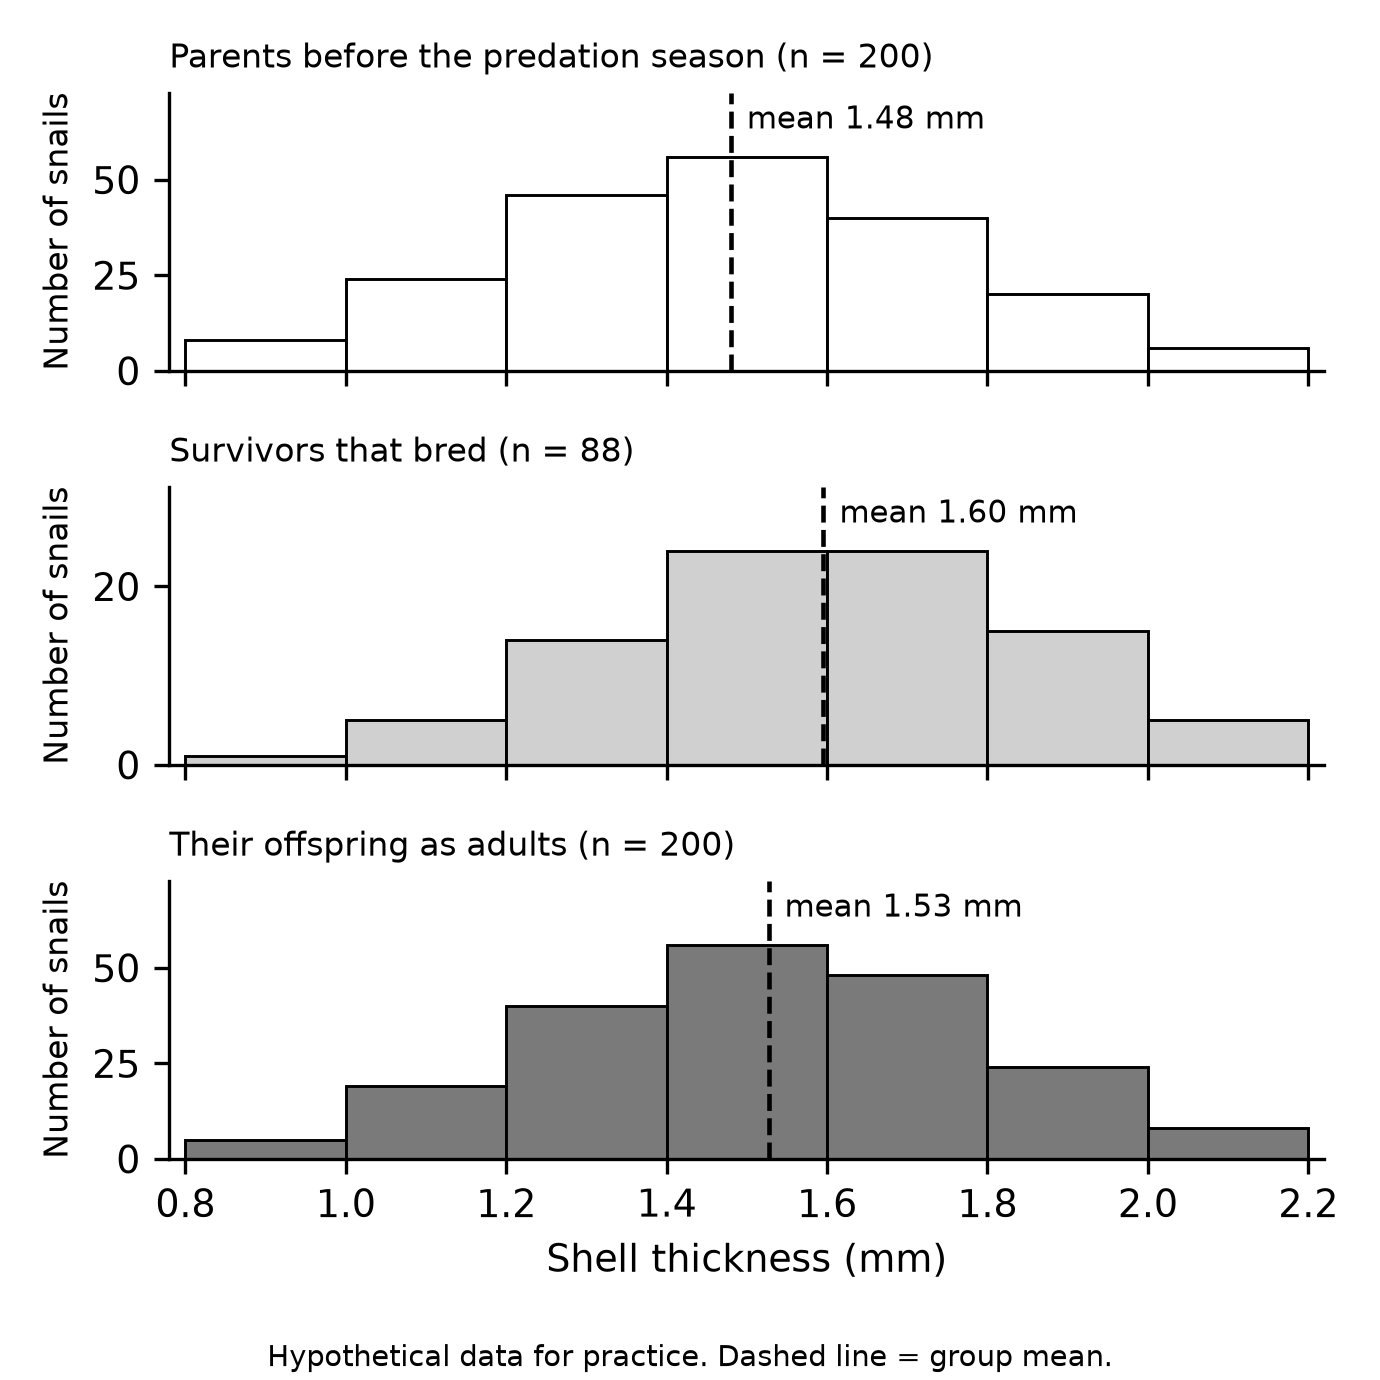
Figure 17.1. One generation of selection on shell thickness in a snail population. Hypothetical data for practice.
Solution. Survival rose with thickness: 1 of the 8 thinnest snails survived to breed (12.5%), but 5 of the 6 thickest did (83%). Survivors averaged 1.60 mm against 1.48 mm before the season. The offspring averaged 1.53 mm, a shift in the same direction but smaller. Part of shell variation comes from food and water chemistry, which is not inherited, so offspring move only partway toward the survivors. The offspring shift is the evidence that some variation is heritable; with no heritable variation, offspring would average 1.48 mm again. Common error: treating the survivors' shift as evolution. Selection acted on individuals within one generation. Evolution is the change between the parents' generation and their offspring's.
Fitness is relative and depends on the environment
Fitness is reproductive success: how many surviving, fertile offspring an individual or genotype leaves compared with others in the same population (UC Berkeley Understanding Evolution, Evolutionary fitness). Strength, size and long life count only when they raise reproduction. Relative fitness divides each type's average offspring by the average of the most successful type. Common error: equating fitness with survival or strength. A long-lived individual that leaves no offspring has a fitness of zero.
Suppose dark beetles leave 3.0 offspring that survive to breed and light beetles leave 2.4. The relative fitness of light beetles is 2.4 ÷ 3.0 = 0.80. If 40% of parents are dark and color is fully inherited, dark offspring make up 0.40 × 3.0 = 1.20 parts out of 1.20 + (0.60 × 2.4) = 2.64 parts, or 1.20 ÷ 2.64 ≈ 45%. One generation of differential reproduction moved dark beetles from 40% to about 45%.
Fitness belongs to a trait in a particular environment. On the Galápagos island of Daphne Major, Peter and Rosemary Grant followed two finch species from 1972 to 2001. Selection on body and beak size occurred often, sometimes in one direction and sometimes reversing, and the species' final states could not have been predicted at the start (Grant and Grant, Science, 2002). Fluctuating environments change both the direction and the rate of evolution.
Try it 17.1. In a pond, rotifer type A leaves 12 surviving offspring on average and type B leaves 9. (a) Find the relative fitness of type B. (b) Type A makes up 25% of the parents and the trait is fully inherited. What percentage of the offspring are type A?
Variation is the raw material
Selection can act only on variation that already exists. After a multiyear drought shortened growing seasons, researchers grew the field mustard Brassica rapa from seeds stored before the drought alongside seeds of descendants collected after it, in the same conditions. Descendants flowered earlier: by 1.9 days in one population and 8.6 days in another. Hybrids were intermediate, and flowering time proved heritable, so the difference was genetic rather than a response to growing conditions (Franks and colleagues, PNAS, 2007).
Variation also shows up directly in molecules. The sickle-cell allele of a hemoglobin gene causes sickle cell disease in people with two copies, yet carriers with one copy are more resistant to Plasmodium falciparum malaria. In Gabon, villages with more falciparum malaria had more carriers, evidence that malaria still selects for the allele (Elguero and colleagues, PNAS, 2015). In many disease-carrying insects, insecticide resistance has been traced to specific DNA differences (Hemingway and Ranson, Annual Review of Entomology, 2000).
Selection changes a trait's distribution in three patterns (OpenStax Biology 2e, Adaptive Evolution).
| Mode | Phenotypes favored | Effect on the distribution |
|---|---|---|
| Directional | one extreme | the mean shifts toward that extreme |
| Stabilizing | intermediate values | the mean stays; variation narrows |
| Disruptive | both extremes | variation widens; two peaks can form |
Table 17.1. Three modes of selection.
Four misconceptions cost points (UC Berkeley Understanding Evolution, Misconceptions about evolution). Organisms do not try to adapt. Mutations do not arise because they are needed. Selection does not give organisms what they need; it can only favor variants already present. Evolution is not progress toward perfection; a trait favored now may be disfavored after the environment changes.
Artificial selection
In artificial selection, humans choose which individuals breed. The logic is the same, heritable variation plus differential reproduction, but human preference does the selecting. Farmers developed several crops from wild mustard, including cabbage (short stems between leaves), broccoli (clusters of undeveloped flowers) and kohlrabi (a swollen stem), by repeatedly breeding plants with the chosen trait (UC Berkeley Understanding Evolution, Artificial selection). Maize was domesticated from a wild teosinte. The traits that distinguish them are controlled by many genes, plus a few genes of large effect (Doebley, Annual Review of Genetics, 2004). In the Illinois Long-Term Selection Experiment, 103 cycles of selection on maize grain protein and oil produced populations with extreme compositions (Moose and colleagues, Trends in Plant Science, 2004).
Worked example 17.2: reading selection lines
In Figure 17.2, three beetle lines start at the same mean pupal mass and live in identical conditions. In each generation the heaviest 20% breed in the high line, the lightest 20% in the low line, and a random 20% in the control line.
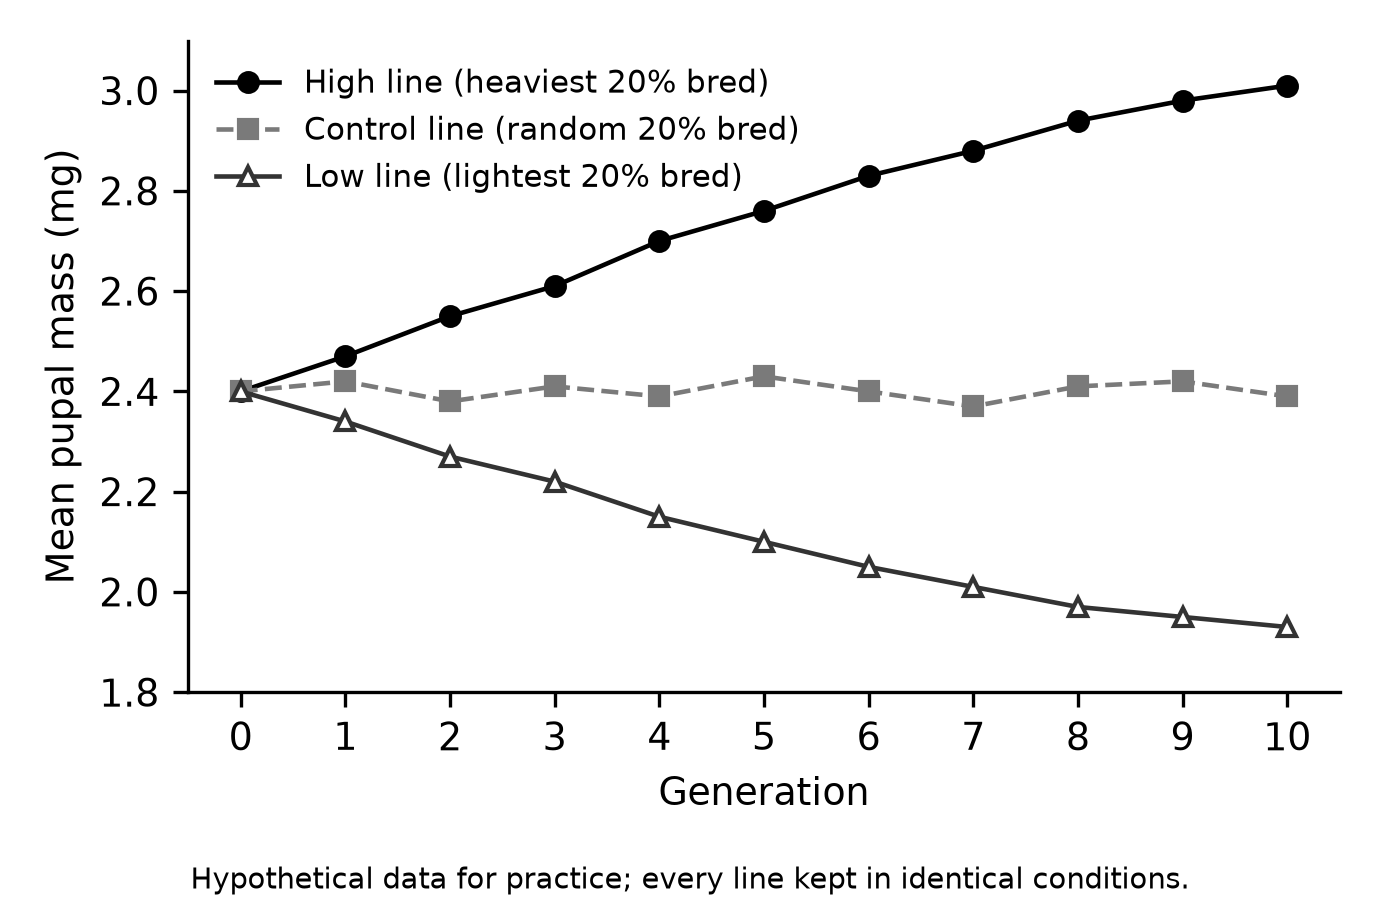
Figure 17.2. Artificial selection on beetle pupal mass. Hypothetical data for practice.
Solution. The high line gained 0.61 mg in 10 generations, about 0.061 mg per generation; the low line lost 0.47 mg, about 0.047 mg per generation. Response in both directions shows heritable variation for pupal mass. The control stayed near 2.40 mg, ruling out a shared environmental trend such as a change in food, which would have moved all three lines. The high line's gains slowed, from 0.15 mg over generations 0 to 2 to 0.07 mg over generations 8 to 10, which suggests the available heritable variation was being used up. Common error: claiming the control cannot change at all. Small random changes still occur there through drift (Chapter 18).
Try it 17.2. (a) From Figure 17.2, find the low line's average change per generation over generations 0 to 5. (b) Why does the experimenter breed a random 20% of the control line instead of every beetle?
Evolution is still happening
Several kinds of evidence show that evolution continues.
- Genomic change. Researchers sequenced 264 genomes from 12 laboratory E. coli populations over 50,000 generations and found that most mutations that rose to high frequency were favored by selection (Tenaillon and colleagues, Nature, 2016). In one population, a variant able to use citrate evolved by about 31,500 generations (Blount and colleagues, PNAS, 2008).
- The fossil record shows that past organisms differ from living ones and documents change over time (OpenStax Biology 2e, Understanding Evolution).
- Resistance. Bacteria evolve antibiotic resistance, which the CDC calls an urgent public health threat (CDC, Antimicrobial Resistance Threats Reports). Insects evolve pesticide resistance, weeds herbicide resistance and cancer cell populations chemotherapy resistance. On a plate more than a meter long carrying bands of antibiotic, researchers could watch bacteria spread and their resistance rise (Baym and colleagues, Science, 2016).
- Changing pathogens. Flu viruses change continually through small mutations, called antigenic drift, which is one main reason flu vaccine composition is reviewed every year (CDC, How flu viruses can change).
- Reversals. Dark peppered moths became common during industrial pollution and have declined rapidly since 1970. A six-year release experiment found bird predation against dark moths strong enough to explain the decline (Cook and colleagues, Biology Letters, 2012).
To test whether a population has evolved resistance, compare it with an unexposed population, rear both for a generation in the same conditions so lifetime acclimation cannot explain a difference, give each a standard dose, and test many individuals.
Worked example 17.3: evolution or acclimation?
Bacteria are sampled from a patient before and after two weeks of antibiotic treatment. Both samples grow for many generations without the drug and are then tested. The lowest drug concentration that stops growth is 2 µg/mL for the first sample and 32 µg/mL for the second. Hypothetical data for practice.
Solution. Growing both samples without the drug removes any short-term response, so the 16-fold difference is inherited: the population evolved. The drug did not create resistance; it favored variants that already existed or arose by random mutation. One limit remains: the second sample could be a different strain that later infected the patient, so compare the two samples' DNA and look for resistance mutations. Common error: saying the bacteria became resistant because they needed to.
Selection never acts alone
| Process | Effect on allele frequencies | Where taught |
|---|---|---|
| Natural selection | increases alleles that improve reproduction in the current environment | this chapter |
| Genetic drift | random changes, strongest in small populations | Chapter 18 |
| Gene flow | moves alleles between populations, making them more alike | Chapter 18 |
| Mutation | supplies new alleles, slowly | Chapters 16 and 18 |
Table 17.2. Processes that change allele frequencies.
A change in frequency alone does not prove selection. Drift can remove a helpful allele, gene flow can bring in alleles that are poorly suited to local conditions, and new mutations can supply the variation selection later acts on. Chapter 18 shows how replicate populations and comparison groups separate these processes.
Check your try-it work
Retrieve first. Replication errors that escape repair, radiation and reactive chemicals. No: mutations are random with respect to need; the environment determines which existing variants succeed.
17.1. (a) 9 ÷ 12 = 0.75. (b) Type A: 0.25 × 12 = 3; type B: 0.75 × 9 = 6.75. Type A makes up 3 ÷ 9.75 ≈ 0.31, about 31%.
17.2. (a) (2.10 − 2.40) ÷ 5 = −0.06 mg per generation. (b) Breeding the same number of beetles keeps population size, and therefore drift and inbreeding, the same as in the selected lines, so the only difference is which beetles breed.
Review and retrieve
Without notes, write the four links of natural selection and apply them to Worked example 17.1. Then rebuild Table 17.1 and sketch each mode. In two days, redo the 45% beetle calculation and Try it 17.1. In a week, explain why the snail offspring shifted less than the survivors.
Practice
Do Questions 199–210 and Written task 19, the short free-response task, printed after this chapter. Questions 199–202 share a flowering-time table, 203–205 an insecticide survival graph, 206 and 207 a set of trait distributions, and 208–210 stand alone. Allow about 10 minutes for the written task and use its printed response page. Explanations for every answer choice, and the task's rubric with a complete sample response and an annotated partial response, appear under "Chapter 17: answers and explanations" in the answers section.