What to practice
- interpret population growth and account for energy transfers
Unit 8 asks you to reason about organisms in their environment rather than inside a single cell. This chapter covers topics 8.1 to 8.4 of the AP Biology Course and Exam Description: how organisms respond to information, how energy flows while matter cycles, and how populations grow and stop growing. Chapter 21 continues with communities. The population equations used here are printed on the AP Biology equations and formulas sheet, so practice reading them from that sheet rather than memorizing new forms.
Organisms respond to changing conditions
Organisms detect environmental cues and change their behavior or physiology in ways that tend to improve survival and reproduction. A plant that flowers when pollinators are active, or an animal that seeks shelter as temperature falls, leaves more offspring than one that ignores the cue. The exam does not ask for the molecular mechanism of a response; it asks you to connect the cue, the response and the fitness consequence.
Photoperiodism is a clear plant example. Many short-day plants are really long-night plants: they flower only when the uninterrupted dark period exceeds a critical length (OpenStax Biology 2e, section 30.6). In classic cocklebur experiments, a brief flash of light in the middle of a long night prevented flowering (Hamner and Bonner, 1938). The plants were measuring the length of uninterrupted darkness, not the length of the day.
Animals respond with movement and with communication. Kinesis is undirected movement: the stimulus changes speed or turning rate, not heading. Taxis is movement directed toward or away from a stimulus (OpenStax Biology 2e, section 45.7). Signals pass between individuals as visual, audible, tactile, electrical or chemical information. Some responses are innate, appearing without prior experience; others are learned and change with experience.
Cooperative behavior also has a fitness logic. An individual that helps relatives can pass on copies of its own alleles through their offspring, so a costly behavior directed at kin can spread by kin selection (Hamilton, 1964). On the exam, explain cooperation in terms of alleles shared with relatives, not "for the good of the species."
Worked example: taxis or kinesis?
A planarian placed in a dish with a piece of liver at one edge turns and moves up the chemical gradient toward the food. Its heading depends on the stimulus, so this is a positive chemotaxis. Woodlice in a chamber that is dry at one end and humid at the other move quickly and turn often in dry air and slow down in humid air. They end up clustered in the humid end even though no individual heads toward it. That is kinesis.
Common error. Calling every aggregation in favorable conditions a taxis. Clustering alone does not show direction; you need evidence that headings, not just speeds, change.
Try it 20.1. In a dish that is half lit and half dark, moth larvae crawl at 6 mm/s in the light and 2 mm/s in the dark. Their headings are random on both sides. After 30 minutes, 80 percent are on the dark side. Classify the response and propose how it could increase survival.
Energy flows; matter cycles
Every ecosystem depends on autotrophs that capture energy. Photosynthetic autotrophs capture light; chemosynthetic autotrophs, such as bacteria at deep-sea hydrothermal vents, capture chemical energy from inorganic molecules such as hydrogen sulfide (OpenStax Biology 2e, section 46.2). Heterotrophs obtain energy by eating other organisms or their remains: herbivores, carnivores, omnivores, scavengers and decomposers.
How an organism spends assimilated energy depends partly on temperature regulation. Endotherms, such as birds and mammals, use heat from their own metabolism to hold body temperature steady. Ectotherms, such as insects, fish and reptiles, rely mainly on environmental heat. Endotherms therefore spend much more assimilated energy on cellular respiration. Net production efficiency (production ÷ assimilation) has been measured at 18 percent for leaf-eating caterpillars but can be as low as 1.6 percent for acorn-eating squirrels (OpenStax Biology 2e, section 46.2).
An organism with a net energy gain can store energy, grow and reproduce. A net loss means stored energy is used up, mass falls and, if it continues, the organism dies. Reproductive strategy can track energy availability. Water fleas (Daphnia) reproduce asexually when food is plentiful (OpenStax Biology 2e, section 43.1); crowding and poor food shift them toward sexually produced resting eggs (Koch, von Elert and Straile, 2009).
Worked example: follow energy through a food chain
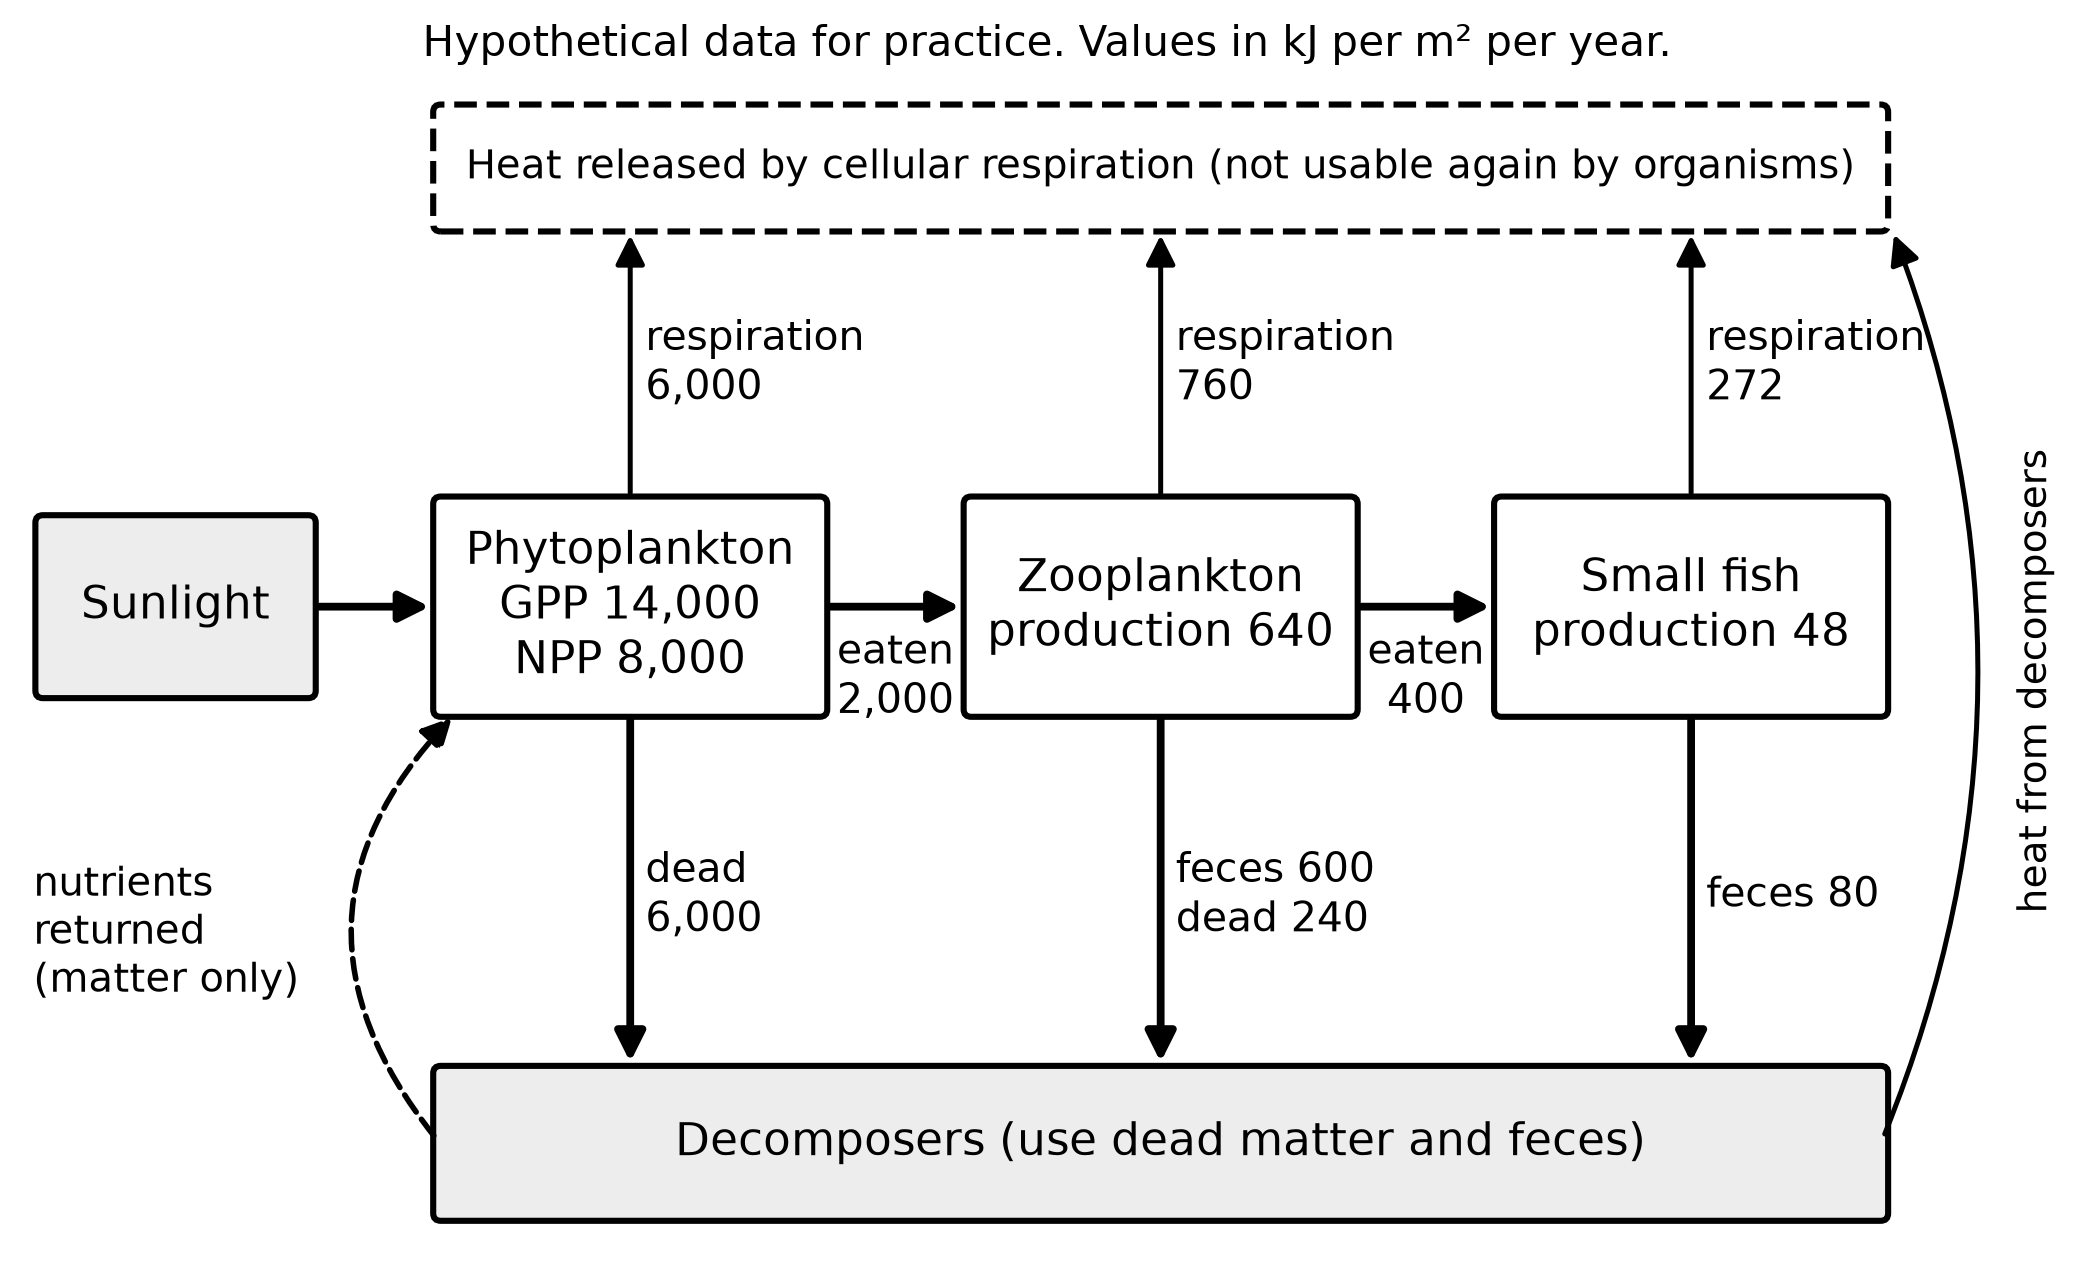
Figure 20.1. Energy budget of a hypothetical pond food chain. Arrows to the decomposers carry both energy and matter; only matter returns to the producers.
Trophic level transfer efficiency compares production at one level with production at the level below:
For the zooplankton, 640 ÷ 8,000 × 100 = 8.0 percent. For the small fish, 48 ÷ 640 × 100 = 7.5 percent. Most of the energy that does not move up was released as heat by cellular respiration; the rest left in feces and dead bodies and was then used, and released as heat, by decomposers. "About 10 percent" is an average, not a law. Measured efficiencies vary widely (Pauly and Christensen, 1995), and the first transfer at Silver Springs, Florida, was about 14.48 percent. Because so little energy passes each step, food chains rarely support more than four to six transfers.
Common error. Writing that decomposers "recycle energy." Decomposers return matter, such as ammonium and phosphate, to producers. The energy in that matter is released as heat and leaves the ecosystem.
Try it 20.2. Using Figure 20.1, (a) calculate the percentage of phytoplankton net primary production that becomes small-fish production, and (b) identify the arrow that carries matter but not usable energy.
Matter cycles between living and nonliving reservoirs
Matter is reused. Carbon, nitrogen and phosphorus build carbohydrates, proteins, nucleic acids, phospholipids and ATP, so a shortage of any one can limit growth.
| Cycle | Main reservoirs | Processes to know |
|---|---|---|
| Water | Oceans, ice, groundwater, atmosphere | Evaporation, transpiration, condensation, precipitation, runoff |
| Carbon | Atmospheric CO₂, oceans, organisms, fossil fuels, sediments | Photosynthesis removes CO₂; cellular respiration, decomposition and combustion return it |
| Nitrogen | Atmospheric N₂, by far the largest; soil; organisms | Fixation (N₂ to NH₃ or NH₄⁺) by bacteria, including Rhizobium in legume root nodules; assimilation; ammonification; nitrification (NH₄⁺ to NO₂⁻ to NO₃⁻); denitrification (NO₃⁻ to N₂) |
| Phosphorus | Rocks and sediments; no significant atmospheric reservoir | Weathering releases phosphate; producers absorb it; consumers eat producers; decomposition and excretion return it |
Most nitrogen transformations depend on soil microorganisms (OpenStax Biology 2e, section 46.3). A change in energy or nutrient supply at the producer level spreads upward: less producer production supports smaller populations, or fewer levels, of consumers.
Try it 20.3. Soybeans, which host Rhizobium, grew in one unfertilized field and corn in another. The next year, corn grew better in the former soybean field. Use the nitrogen cycle to explain why.
Population growth: births, deaths and per-capita rates
A population changes size because individuals are born and die (immigration and emigration are ignored here). The formula sheet writes this as
where B and D are births and deaths per unit time. Dividing by N gives the per-capita growth rate, the change per individual. When resources are not limiting, the per-capita rate stays at its maximum, , and growth is exponential:
Each individual contributes the same share, so the number added per unit time rises as N rises and the graph of N against time curves upward in a J shape (OpenStax Biology 2e, section 45.3). Populations colonizing new habitat or recovering after a disturbance can grow this way for a while.
Worked example: rate per individual versus rate for the population
A brine shrimp culture has 250 individuals, with = 0.12 per day. Then dN/dt = 0.12 × 250 = 30 individuals per day. At N = 500 with the same , dN/dt = 60 per day. The population's growth rate doubled; the per-capita rate did not change.
Common error. Treating r and dN/dt as the same quantity. Check units: r is per time (per day), and dN/dt is individuals per time.
Try it 20.4. A herd of 800 deer has 120 births and 72 deaths in one year. Calculate dN/dt and the per-capita growth rate. If the per-capita rate stays the same, predict dN/dt when the herd reaches 1,000.
Density, limits and carrying capacity
No population grows exponentially for long. Carrying capacity (K) is the maximum population size that an environment can sustain. Density-dependent factors have stronger effects per individual as density rises: competition for food and space, predation, disease and waste accumulation. Density-independent factors act regardless of density: a frost, flood or fire can kill the same fraction of a sparse or a dense population (OpenStax Biology 2e, section 45.4). The logistic model adds density dependence:
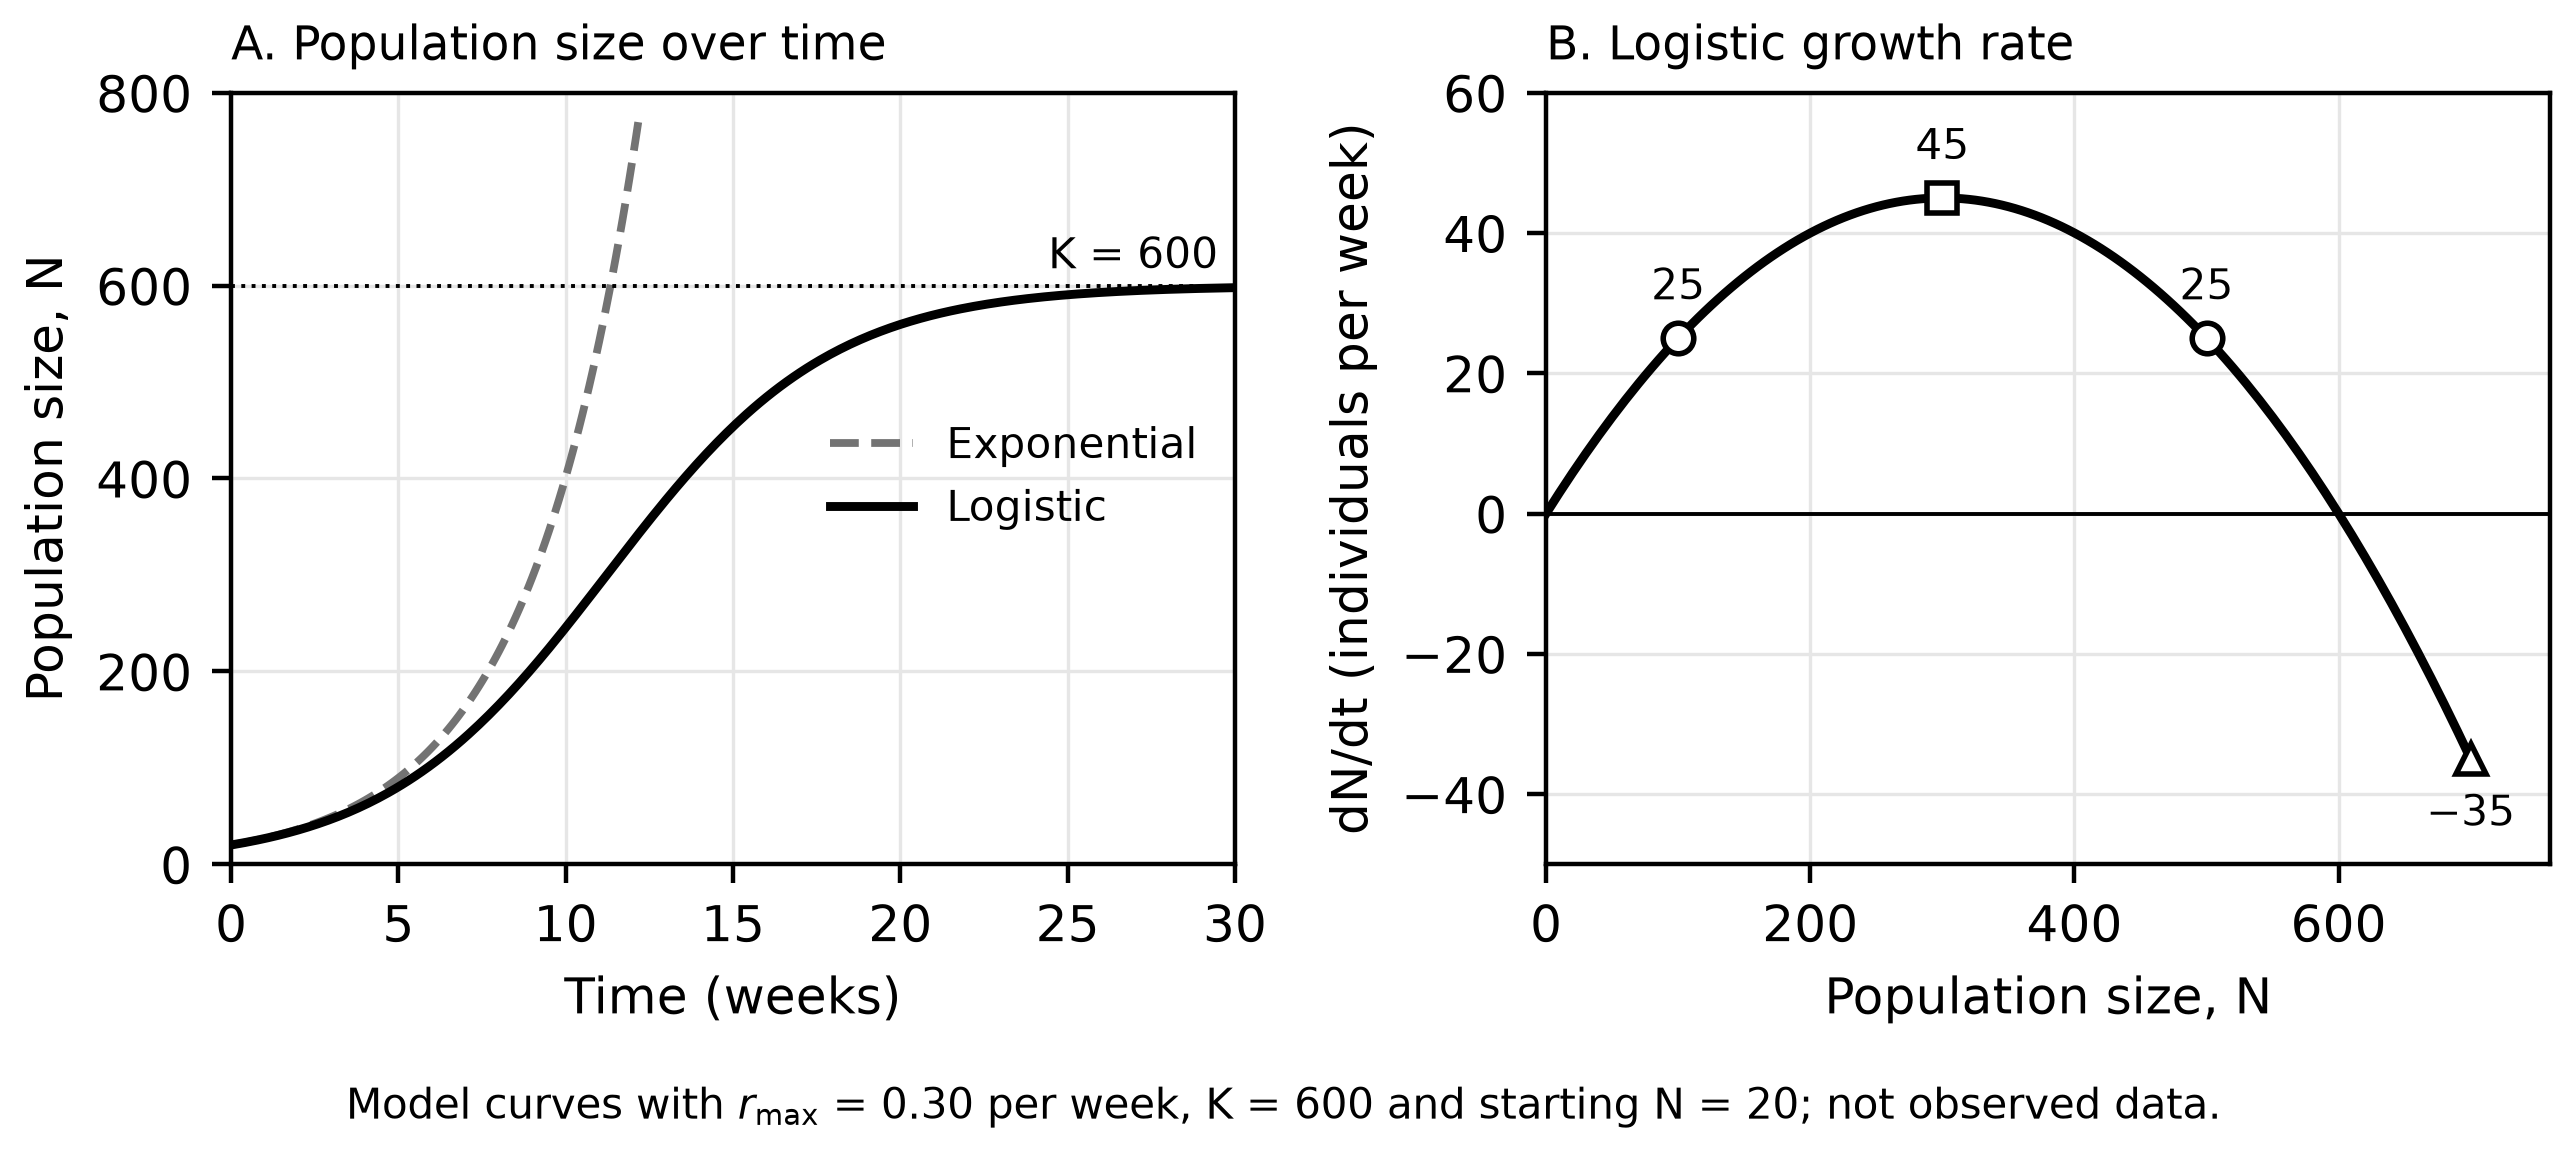
Figure 20.2. Exponential and logistic models with = 0.30 per week and K = 600, starting from 20 individuals.
Worked example: read the logistic equation
Use Figure 20.2's values. At N = 100, dN/dt = 0.30 × 100 × (500 ÷ 600) = 25 individuals per week, a per-capita rate of 0.25 per week. At N = 300, dN/dt = 0.30 × 300 × 0.5 = 45, and the per-capita rate is 0.15. At N = 500, dN/dt = 25 again, but the per-capita rate has fallen to 0.05. The per-capita rate drops steadily as N rises, while the population's growth rate peaks at K/2. Above K the sign flips: at N = 700, dN/dt = 0.30 × 700 × (−100 ÷ 600) = −35, and the population declines toward K.
Common errors. Saying growth is fastest when the population is smallest; that holds for the per-capita rate, not for dN/dt. Treating K as a fixed trait of a species; K belongs to a population in a particular environment and rises or falls when resources change.
Try it 20.5. For a population with = 0.50 per year and K = 2,000, calculate dN/dt at N = 1,500 and at N = 2,400. Interpret each sign.
Check your try-it work
20.1. Kinesis: speed changes and headings stay random, yet slower movement keeps larvae in the dark longer. Reasonable fitness link: larvae in darkness may be less visible to visual predators, so more survive to reproduce.
20.2. (a) 48 ÷ 8,000 × 100 = 0.6 percent. (b) The dashed "nutrients returned" arrow from decomposers to phytoplankton; producers absorb inorganic nutrients but take their energy from sunlight.
20.3. Rhizobium fixed atmospheric N₂ into ammonium. Decomposing soybean residues released more ammonium (ammonification), and nitrifying bacteria converted it to nitrate. The corn absorbed that nitrogen to build proteins and nucleic acids.
20.4. dN/dt = 120 − 72 = 48 deer per year; per-capita rate = 48 ÷ 800 = 0.06 per year. At 1,000 deer: 0.06 × 1,000 = 60 per year.
20.5. At 1,500: 0.50 × 1,500 × (500 ÷ 2,000) = 187.5, about 188 individuals per year; positive, so the population still grows, at a per-capita rate of 0.125. At 2,400: 0.50 × 2,400 × (−400 ÷ 2,000) = −240 per year; negative, because the population exceeds K and deaths outnumber births.
Practice
Complete the printed practice after this chapter's companion panel: Questions 239–254, then two free-response questions. Written task 22 is a long question (9 points) that includes a graph; allow about 22 minutes. Written task 23 is a short data-analysis question (4 points); allow about 10 minutes. Give the multiple-choice set about 24 minutes. A four-function or scientific calculator is allowed. Check your work in "Answers, explanations and written responses" at the back of the book, under "Chapter 20: answers and explanations." Each item names the section of this chapter to reread if you miss it.
Redo every missed item two days later without notes, then again one week later. For error-bar reading, return to Chapter 3; for cellular respiration and heat, Chapter 9. Chapter 21 applies these ideas to communities.