What to practice
- Translate sign and concavity information between derivative graphs
Chapter 11 read the sign of . This chapter adds a second layer: how itself changes, which measures. Keep the levels straight. The sign of says whether rises or falls; whether rises or falls says how the graph of bends. A graph of one level gives information about the others, but not all of it. A graph of fixes the shape of , not its height.
Predict first. A graph falls from left to right and is concave up. Are its slopes increasing or decreasing? Keep your answer for the next section.
Concavity measures changing slope (topic 5.6)
The graph of is concave up on an open interval if is increasing there, and concave down if is decreasing. When exists, on an interval gives concave up and gives concave down. Concavity is about slopes changing, not about height or direction. A falling graph can be concave up: its slopes are negative but increasing toward 0, which answers the prediction.
A point of inflection is a point where is continuous and its concavity changes. Inputs where or does not exist are only candidates. A candidate becomes an inflection point when the sign of actually changes there.
Common errors. Concave up does not mean increasing, and a zero of is not automatically an inflection point. Nor does an inflection point require . For , is undefined at 0, yet it is positive for and negative for , so the graph changes concavity at the origin.
Concavity and tangent lines. Near a point where the graph is concave up, the graph lies above its tangent line, so a tangent-line estimate there is an underestimate; where it is concave down, the estimate is an overestimate. Chapter 10 used this fact for local linear approximation.
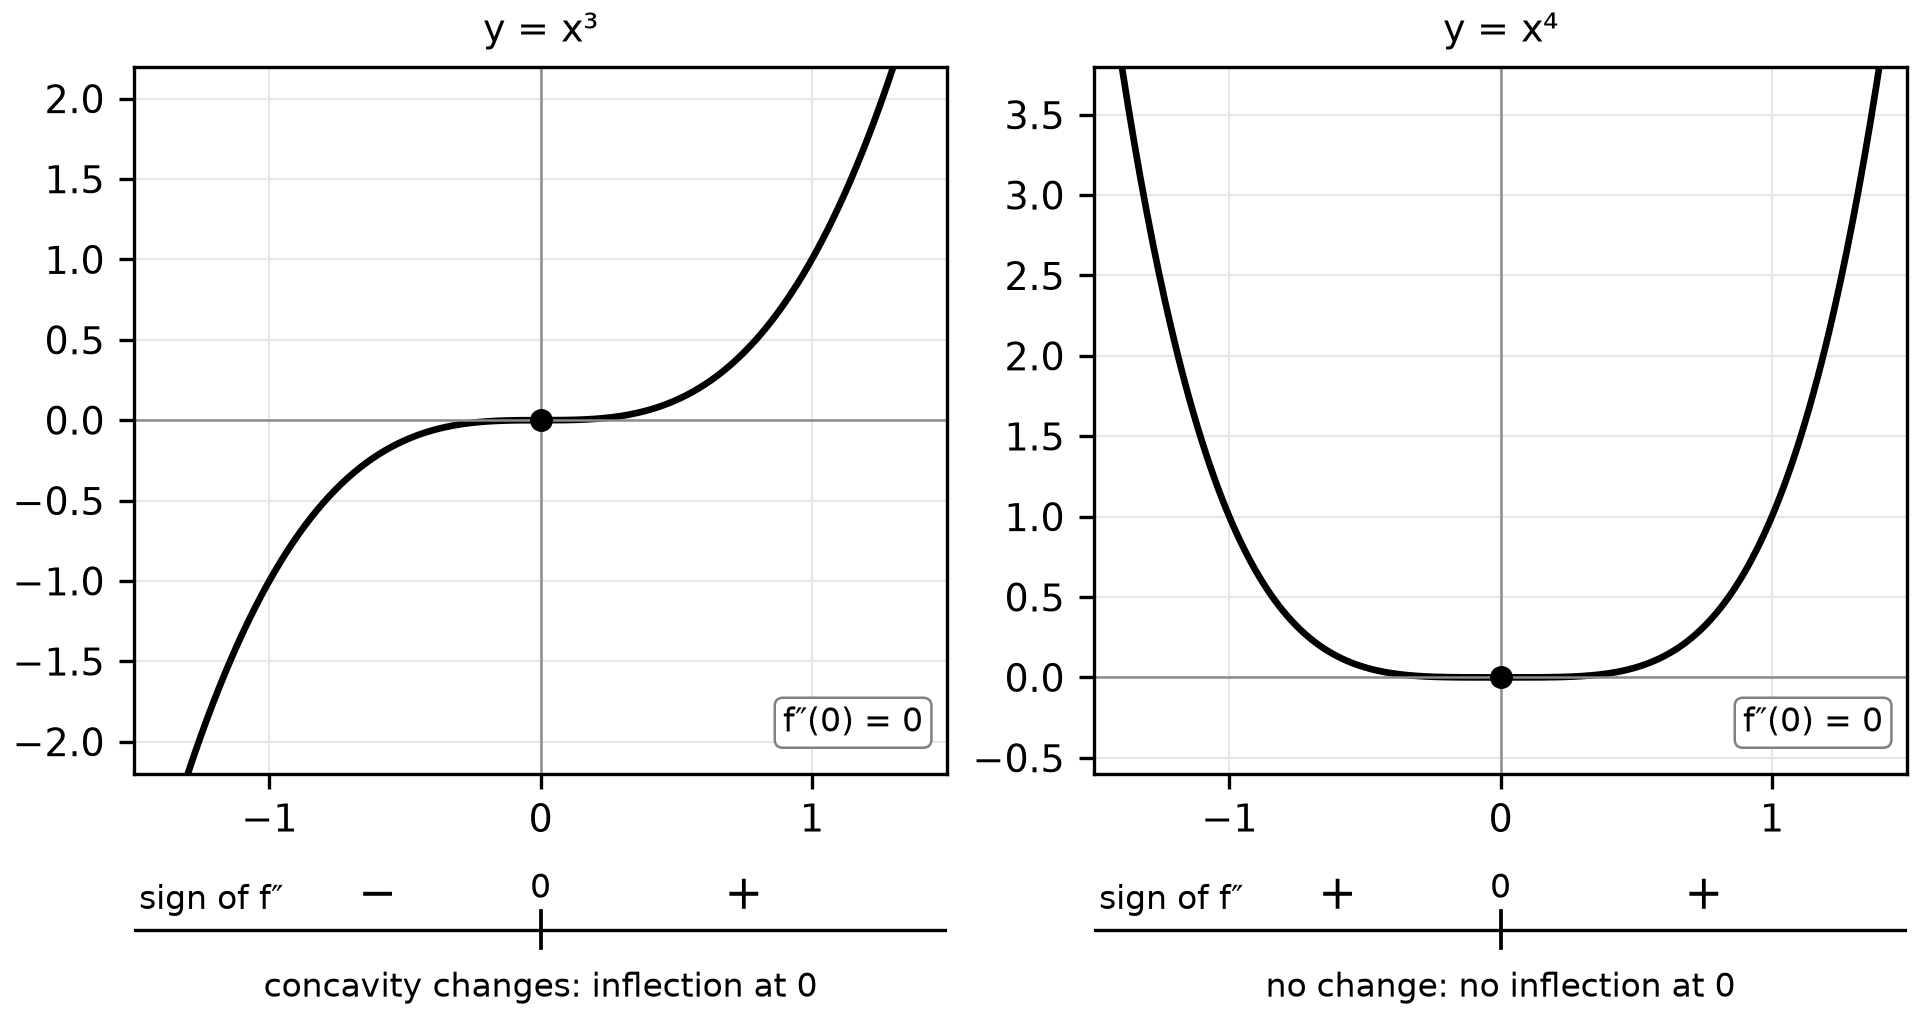
Figure 12.1. Both functions have . Only changes concavity at 0, so only it has a point of inflection there.
Worked example 12.1: concavity from a formula. Analyze the concavity of .
and . Check the second derivative by differentiating : . Because , has the sign of . The graph is concave down on and concave up on , with a point of inflection at . Direction is independent: decreases on , bending down on and up on .
Worked example 12.2: diagnose an incorrect solution. For , a student writes: " at and , so the graph has points of inflection at both."
The student found candidates and stopped. Factor: . The factor is positive except at 0, so has the sign of : negative on both sides of 0 and positive for . Repair: " changes sign at and not at , so the only point of inflection is ."
The Second Derivative Test (topic 5.7)
Suppose and exists. If , has a relative maximum at : a horizontal tangent on a graph that bends down. If , has a relative minimum at . If , the test gives no conclusion. The functions , and all have and , yet they give a minimum, a maximum and neither. Return to the First Derivative Test.
One more conclusion is often useful. If a continuous function has only one critical number on an interval and that critical number gives a relative extremum, it gives the absolute extremum on that interval. Worked example 11.6(b) used this idea.
Worked example 12.3: choose the test. Classify the critical numbers of (a) and (b) .
(a) , so the critical numbers are , 0 and 2. Since is easy to evaluate, use the Second Derivative Test: gives a relative maximum, and gives relative minima.
(b) , with critical numbers , 0 and 1. With , gives a relative maximum and a relative minimum. But , so switch tests. is negative on and on , so has no extremum at 0. Use the Second Derivative Test when is easy and nonzero; use the First Derivative Test when or when intervals are needed anyway.
Try it 12.1. For , classify each critical number with the Second Derivative Test, then find the -coordinates of the points of inflection.
Solution. and . and give relative minima; gives a relative maximum. at , about 0.423 and 1.577. These are simple zeros of a quadratic, so changes sign at each and both are inflection points.
Where is a function changing most rapidly?
The rate of change of is , so "increasing most rapidly" asks for the absolute maximum of , not of . Apply Chapter 11's Candidates Test one level up: on a closed interval, compare at both endpoints and at every input where is 0 or undefined.
Worked example 12.4: the rate's candidates. For on , and , which is 0 at . Compare , and . The function increases most rapidly at the endpoint and decreases most rapidly at , its inflection point. An inflection point marks a rate that is extreme only among nearby inputs; here the endpoint wins the maximum.
With a calculator. When cannot be solved by hand, differentiate as far as you reliably can, graph (or the numerical derivative of ) in radian mode on the stated interval, locate each zero with the solver, and confirm the sign change by evaluating on both sides. A graph of alone rarely shows where its bending changes. Store full values before reusing them (Chapter 23).
Read one graph to learn about another (topics 5.8 and 5.9)
| Evidence about | Conclusion about |
|---|---|
| (or ) on an interval | is increasing (or decreasing) there |
| changes from to (or to ) | relative maximum (or minimum) of |
| is increasing (or decreasing) | graph of is concave up (or down) |
| relative extremum of | point of inflection of |
The same table works one level up, with describing . What a graph of cannot give is the height of . Functions that differ by a constant share a derivative, so one known value, an anchor such as , is needed to place .
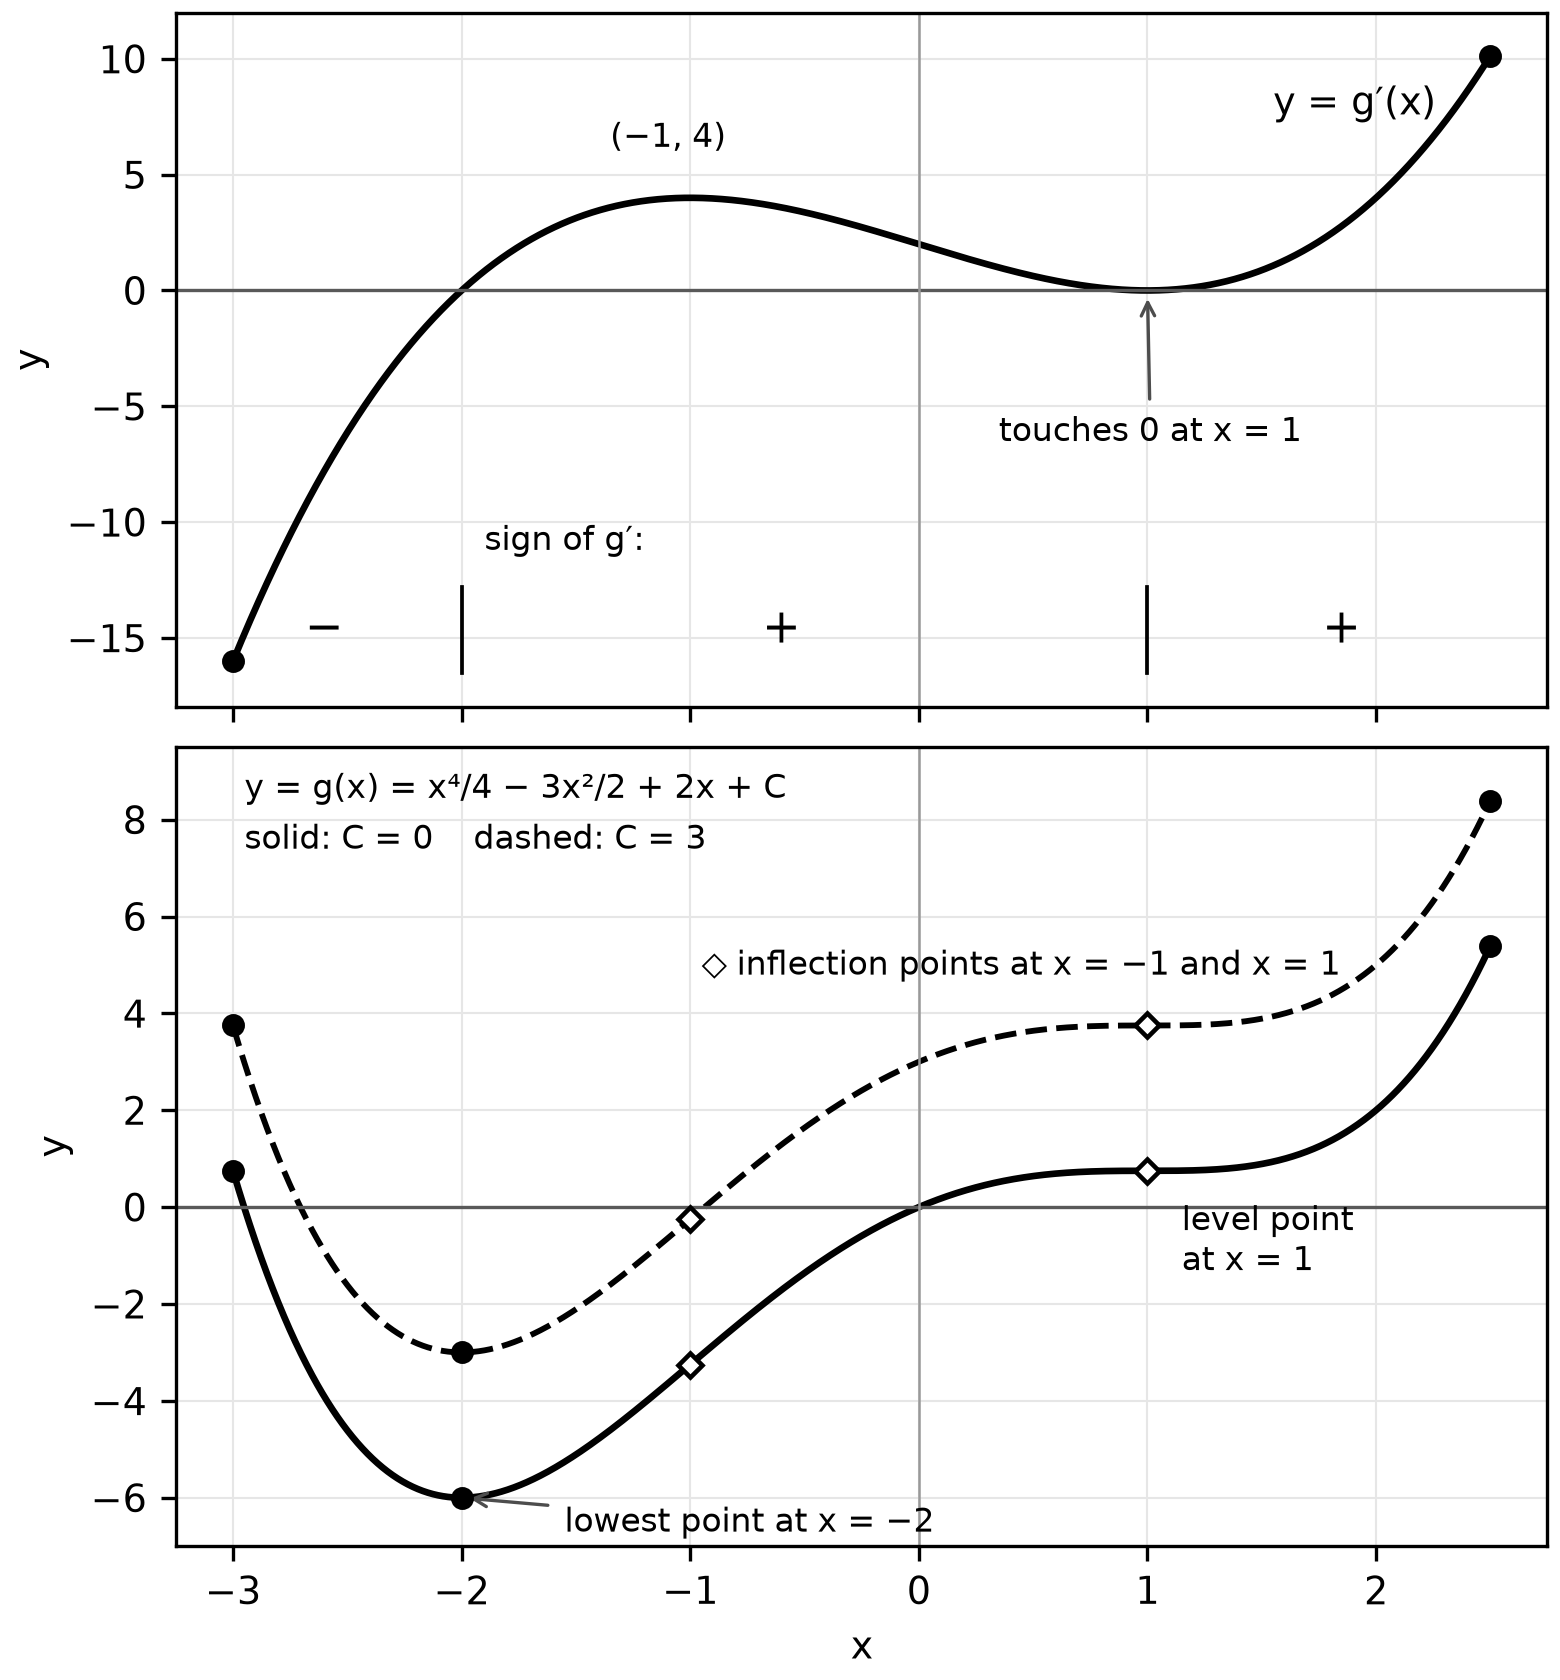
Figure 12.2. A derivative graph and two functions that share it. Every location matches; only the heights differ.
Worked example 12.5: read a derivative graph. Using only the top panel of Figure 12.2, describe .
- Direction. on and on and . So has a relative minimum at . At , touches 0 without changing sign: a horizontal tangent, but no extremum.
- Concavity. increases on , decreases on and increases on . So is concave down only on , with points of inflection at and .
- Independent check. Expanding, , so , whose signs agree.
- Height. Both lower curves fit every statement; an anchor such as selects the dashed one.
Worked example 12.6: sketch from a description. A function is continuous on with . on and on ; on and on . Build a feature list before drawing. From the graph rises while bending down. It peaks at , which is the absolute maximum because increases before 2 and decreases after it. It falls while bending down to an inflection point at , then keeps falling while bending up, so its descent flattens. Any curve with these features is acceptable. The data fix no height beyond , so do not invent one.
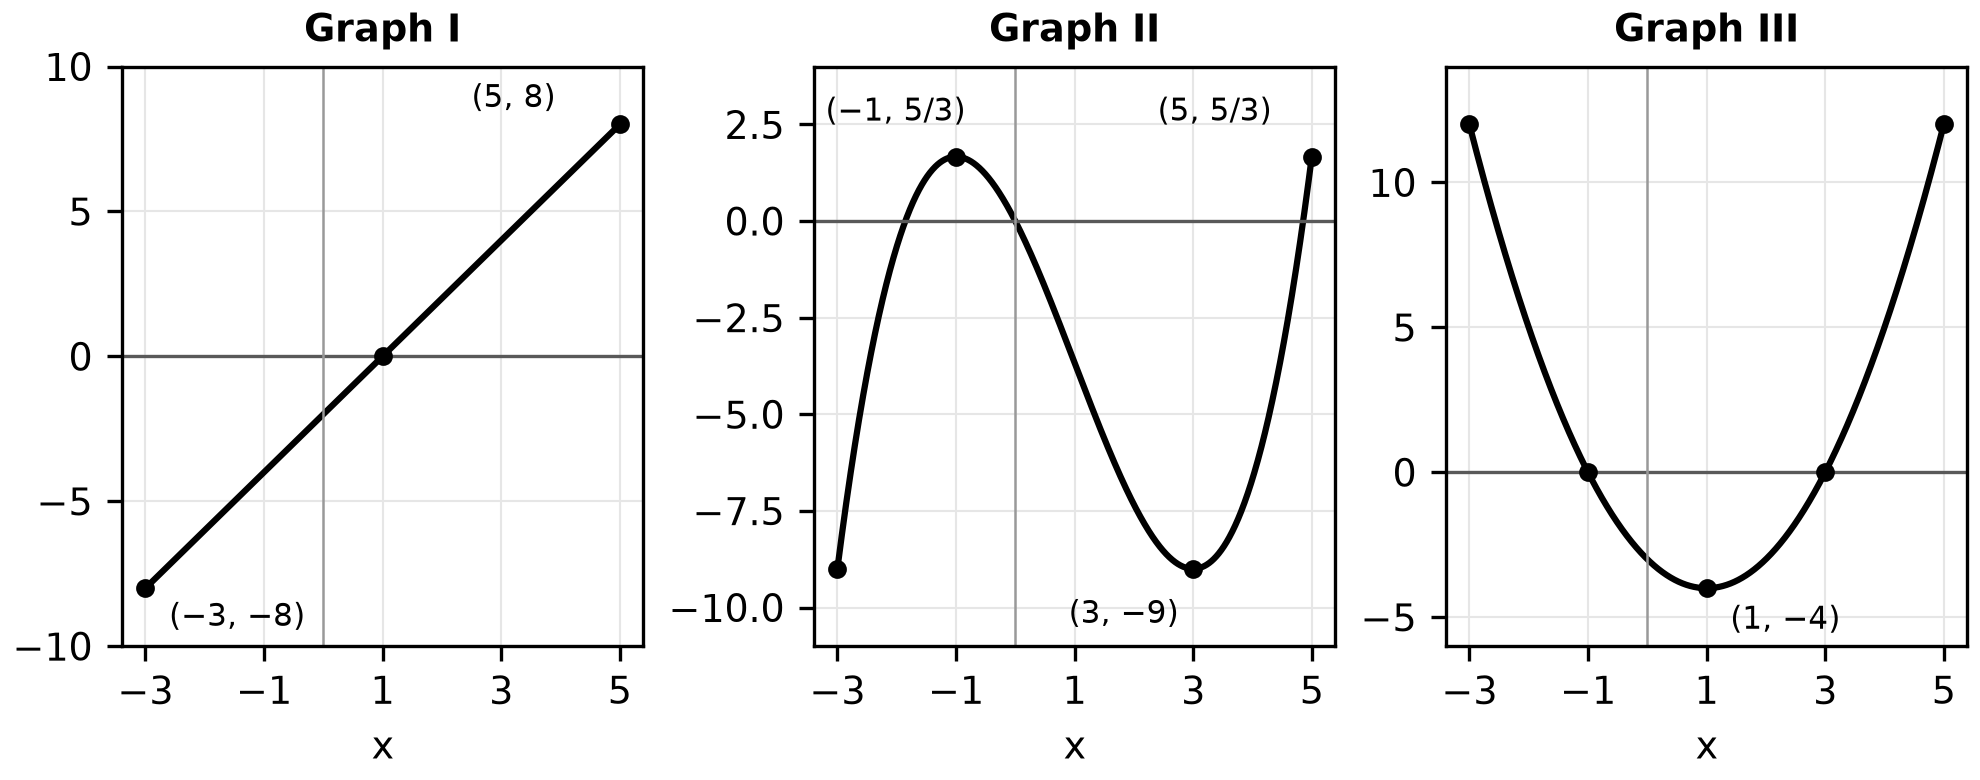
Figure 12.3. One function, its derivative and its second derivative, in an unknown order.
Worked example 12.7: match three graphs. Figure 12.3 shows , and in some order. Look for a graph whose zeros line up with another graph's turning points. Graph III crosses zero at and 3, exactly where graph II turns, and III is positive where II rises. So III is the derivative of II. Graph I crosses zero at 1, where III has its lowest point, and I is negative where III falls. So I is the derivative of III. Therefore II is , III is and I is . Check the other orders: graph I is a line, so its derivative would be a constant, which no graph shows; and graph II is 0 at the origin rather than at , where III turns, so II is not the derivative of III.
Try it 12.2. A twice-differentiable has and , with for and for . Classify and , locate the point of inflection, and explain why is least at .
Solution. , so gives a relative maximum; , so gives a relative minimum. changes sign at , so the point of inflection is at . Since before 1 and after it, decreases and then increases, so is its least value.
Write justifications from derivative graphs
Name the level you are reading. " is concave down on because is decreasing there" is complete. "Because is decreasing" uses the wrong level, and "because is decreasing" describes how concavity changes, not its sign. For an inflection point, write " changes sign at " or " changes from decreasing to increasing at ," never only "." When the supplied graph is of , say so: "the graph of is above the axis on ."
For the Second Derivative Test, state both facts: " and , so has a relative maximum at ." A negative alone says only that the graph bends down near 2; without the test has not been applied. When a question asks how behaves, treat as its derivative and reuse the same sentences one level up.
Practice
This chapter's bank items are APCAL-C12-M01 to APCAL-C12-M15, printed after the companion panel as Questions 154–168, and the nine-point written tasks APCAL-C12-F01 and APCAL-C12-F02, printed as Written tasks 16 and 17. Questions 164–168 and Written task 17 require a graphing calculator in radian mode; the rest are without a calculator. Answers, the error behind each wrong choice, rubrics and complete responses are under Chapter 12: answers and explanations in Answers, explanations and written responses.
For retrieval, wait two days, then redraw Figure 12.2's top panel from memory and rewrite Worked example 12.5's four conclusions. About a week later, mix this chapter with Chapter 11: for , find the relative extrema and inflection points without labels telling you which test to use. Check: a relative minimum at , no extremum at , and inflection points at and .