What to practice
- Connect signed sums, integral notation and accumulation-function behavior
Units 2 through 5 started with an amount and asked how fast it changes. Unit 6 reverses the question: given a rate, how much has accumulated? This chapter builds the answer in four steps. A rate times a width gives an amount (topic 6.1). Sums of such products estimate accumulation from tables and graphs (topic 6.2). Their limit defines the definite integral (topic 6.3). An accumulation function then changes at exactly the rate being accumulated, and a graph of that rate describes the accumulation function's behavior (topics 6.4 and 6.5). Chapter 15 turns these ideas into exact evaluation with antiderivatives. Here you work from geometry, sums and derivatives.
Predict first. Water flows into a tank at 30 liters per minute for 4 minutes, then drains at 20 liters per minute for 3 minutes. Is the tank fuller or emptier than at the start, and by how much? Keep your answer for Worked example 14.1.
Rate times width gives accumulated change (topic 6.1)
If a rate is constant, the amount accumulated is rate times elapsed input: 30 liters per minute for 4 minutes gives 120 liters. On a graph of the rate, that product is the area of a rectangle. When the rate varies, the area between the rate graph and the horizontal axis still gives the accumulated change. Units follow the product: (rate unit) times (input unit), so liters per minute times minutes gives liters.
Area below the axis counts as negative. A negative rate means the amount is decreasing, so that region subtracts from the net change. The net change is the signed total. The gross amount, such as the total volume that passed through a pump in either direction, adds the areas without signs.
Worked example 14.1: a pump that reverses
A pump moves water into a tank at 30 liters per minute for 4 minutes, out at 20 liters per minute for the next 3 minutes, then in at 10 liters per minute for 2 minutes. Describe the change in the tank.
Draw the rate as three horizontal segments: height 30 on , height on and height 10 on . The signed areas are , and .
- Net change: liters. After 9 minutes the tank holds 80 liters more than at the start. After 7 minutes, the moment in the prediction, it holds liters more.
- Gross amount pumped: liters of water moved through the pump.
- When was the tank fullest? The amount rises while the rate is positive and falls while it is negative, so compare the ends of the rising stretches: liters above the start at and at . The fullest moment is .
The third question is a preview of topic 6.5. The rate tells you how the amount moves, and its sign changes mark where the amount turns.
Common error. Answering a net question with a gross amount, or the reverse. "How much more water is in the tank?" asks for the signed total. "How much water passed through the pump?" asks for the total without signs. Read which one the question wants before you add areas.
Approximate accumulation with Riemann sums (topic 6.2)
When the rate is known only at some inputs, split the interval into subintervals, choose one rate value for each, and add (rate value) times (width). Four standard choices appear on the exam.
| Sum | Height used on each subinterval |
|---|---|
| Left | the value at the left end |
| Right | the value at the right end |
| Midpoint | the value at the middle, if it is known |
| Trapezoidal | the average of the two end values |
The subintervals need not have equal widths. Use the width of each one. A table normally supports left, right and trapezoidal sums. A midpoint sum needs values at the midpoints, so with a table it usually uses wider subintervals whose midpoints are listed.
Over or under? If the rate is increasing on a subinterval, the left value is the smallest there, so the left sum underestimates and the right sum overestimates. If it is decreasing, the roles swap. This conclusion needs monotonic behavior on every subinterval, stated in the problem or visible on a graph. Table values alone do not show what happens between entries.
Worked example 14.2: sums from unequal time steps
The table gives the rate , in visitors per hour, at which people enter a county fair hours after the gates open. It is constructed practice data.
| (hours) | 0 | 1 | 3 | 4 | 7 |
|---|---|---|---|---|---|
| (visitors per hour) | 120 | 160 | 220 | 200 | 110 |
The widths are 1, 2, 1 and 3 hours.
- Left: visitors.
- Right: visitors.
- Trapezoidal: visitors.
The trapezoidal sum is the average of the left and right sums, a useful check. In context: about 1195 visitors entered during the first 7 hours. Figure 14.1 draws the left sum as rectangles under one possible curve through the table. The curve is an illustration; the table does not determine the rate between its entries.
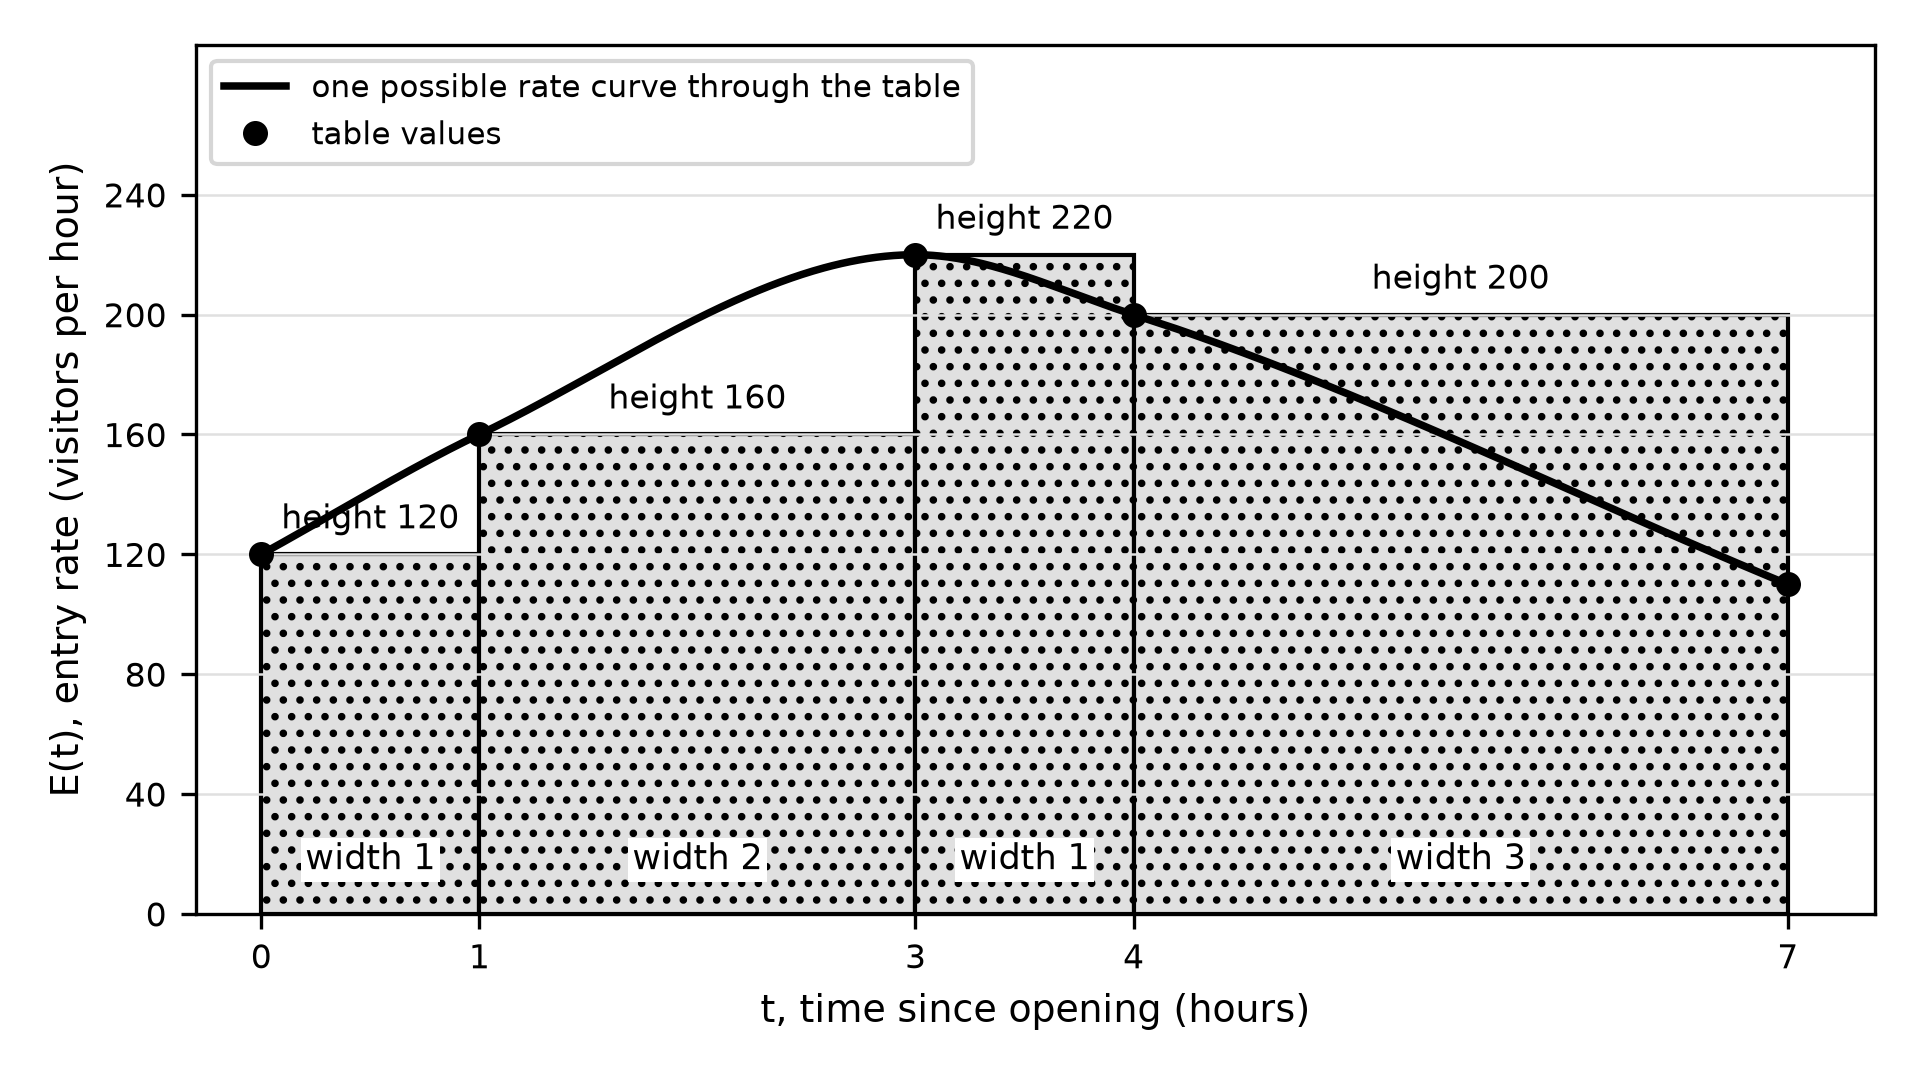
Figure 14.1. A left Riemann sum with unequal widths. Each rectangle's area is a height from the table times its own width.
Worked example 14.3: diagnose a table estimate
A student estimates the fair's total with a left sum and writes:
"There are 4 subintervals on , so . The estimate is visitors. Since is decreasing at the end, this is an overestimate."
Two errors. First, the formula assumes equal widths, but these widths are 1, 2, 1 and 3. Each product must use its own width, which gives 1260. Second, the over/under claim has no support. The table shows , but it does not say decreases throughout each subinterval, and the left sum overestimates only where the rate decreases. Figure 14.1 shows why one curve cannot settle it: on the first two subintervals its rectangles fall short, and on the last two they overshoot.
Repair: "The left sum is visitors. Without information that is monotonic on each subinterval, the table alone cannot show whether 1260 is an overestimate or an underestimate."
Turn a limit of sums into a definite integral (topic 6.3)
Divide into equal subintervals of width , with right endpoints . For a continuous function , the right sums approach a single number as increases, and that number is the definite integral:
Left and midpoint sums have the same limit. The integral is the signed area between the graph of and the -axis from to ; when is a rate, it is the net change.
To read a limit of sums, find three ingredients. The factor multiplying the sum gives . The expression for gives the starting value . The function applied to gives . Then .
Worked example 14.4: read the sum's ingredients
Write as a definite integral and evaluate it.
Method choice. There are two valid readings. With and , the start is and the end is . The function applied to is :
Alternatively, let on , so the summand is and the integral is . The two integrals describe the same region shifted one unit, and both equal the area of a trapezoid with parallel sides 1 and 4 and width 3: . Choose whichever reading makes the geometry or the next step simplest. Do not mix them: would add the shift twice.
Differentiate an accumulation function (topic 6.4)
For a function continuous on an interval containing , define
the signed area from to a variable endpoint . The Fundamental Theorem of Calculus says : the accumulated amount grows at the rate being accumulated. When the upper limit is a function , the chain rule adds a factor:
A constant lower limit contributes nothing to the derivative. If the variable is in the lower limit, reverse the bounds first, which changes the sign: .
Worked example 14.5: a variable upper limit
Let . Find and .
With , , and .
Two wrong answers are common. "" subtracts the integrand's value at the lower limit, as if evaluating; but the lower limit is a constant and contributes 0. "" substitutes but drops the chain factor . Check by asking what happens when changes: changes times as fast, so area accumulates times as fast.
Read an accumulation function from its rate graph (topic 6.5)
Because , a graph of is a graph of the slopes of . Every Chapter 12 test applies, with in the role of .
- increases where and decreases where .
- has a relative maximum where changes from positive to negative, and a relative minimum where it changes from negative to positive.
- is concave up where is increasing and concave down where is decreasing; points of inflection of occur where changes between increasing and decreasing.
- Values of come from signed areas, starting from .
Worked example 14.6: from the graph of to the behavior of
The graph of in Figure 14.2A consists of segments joining , , and . Let for .
Values. The region on is a trapezoid of area . The segment from to crosses the axis at , giving triangles of signed area and . The last region is a triangle of signed area . So , , and .
Direction. on and on , so has its absolute maximum, 6.25, at . For the absolute minimum, compare the candidates , and : the minimum is , at the endpoint .
Concavity. increases on , decreases on and increases on . So the graph of is concave up, then down, then up, with points of inflection at and . Figure 14.2B confirms every conclusion, but each one came from Figure 14.2A alone.
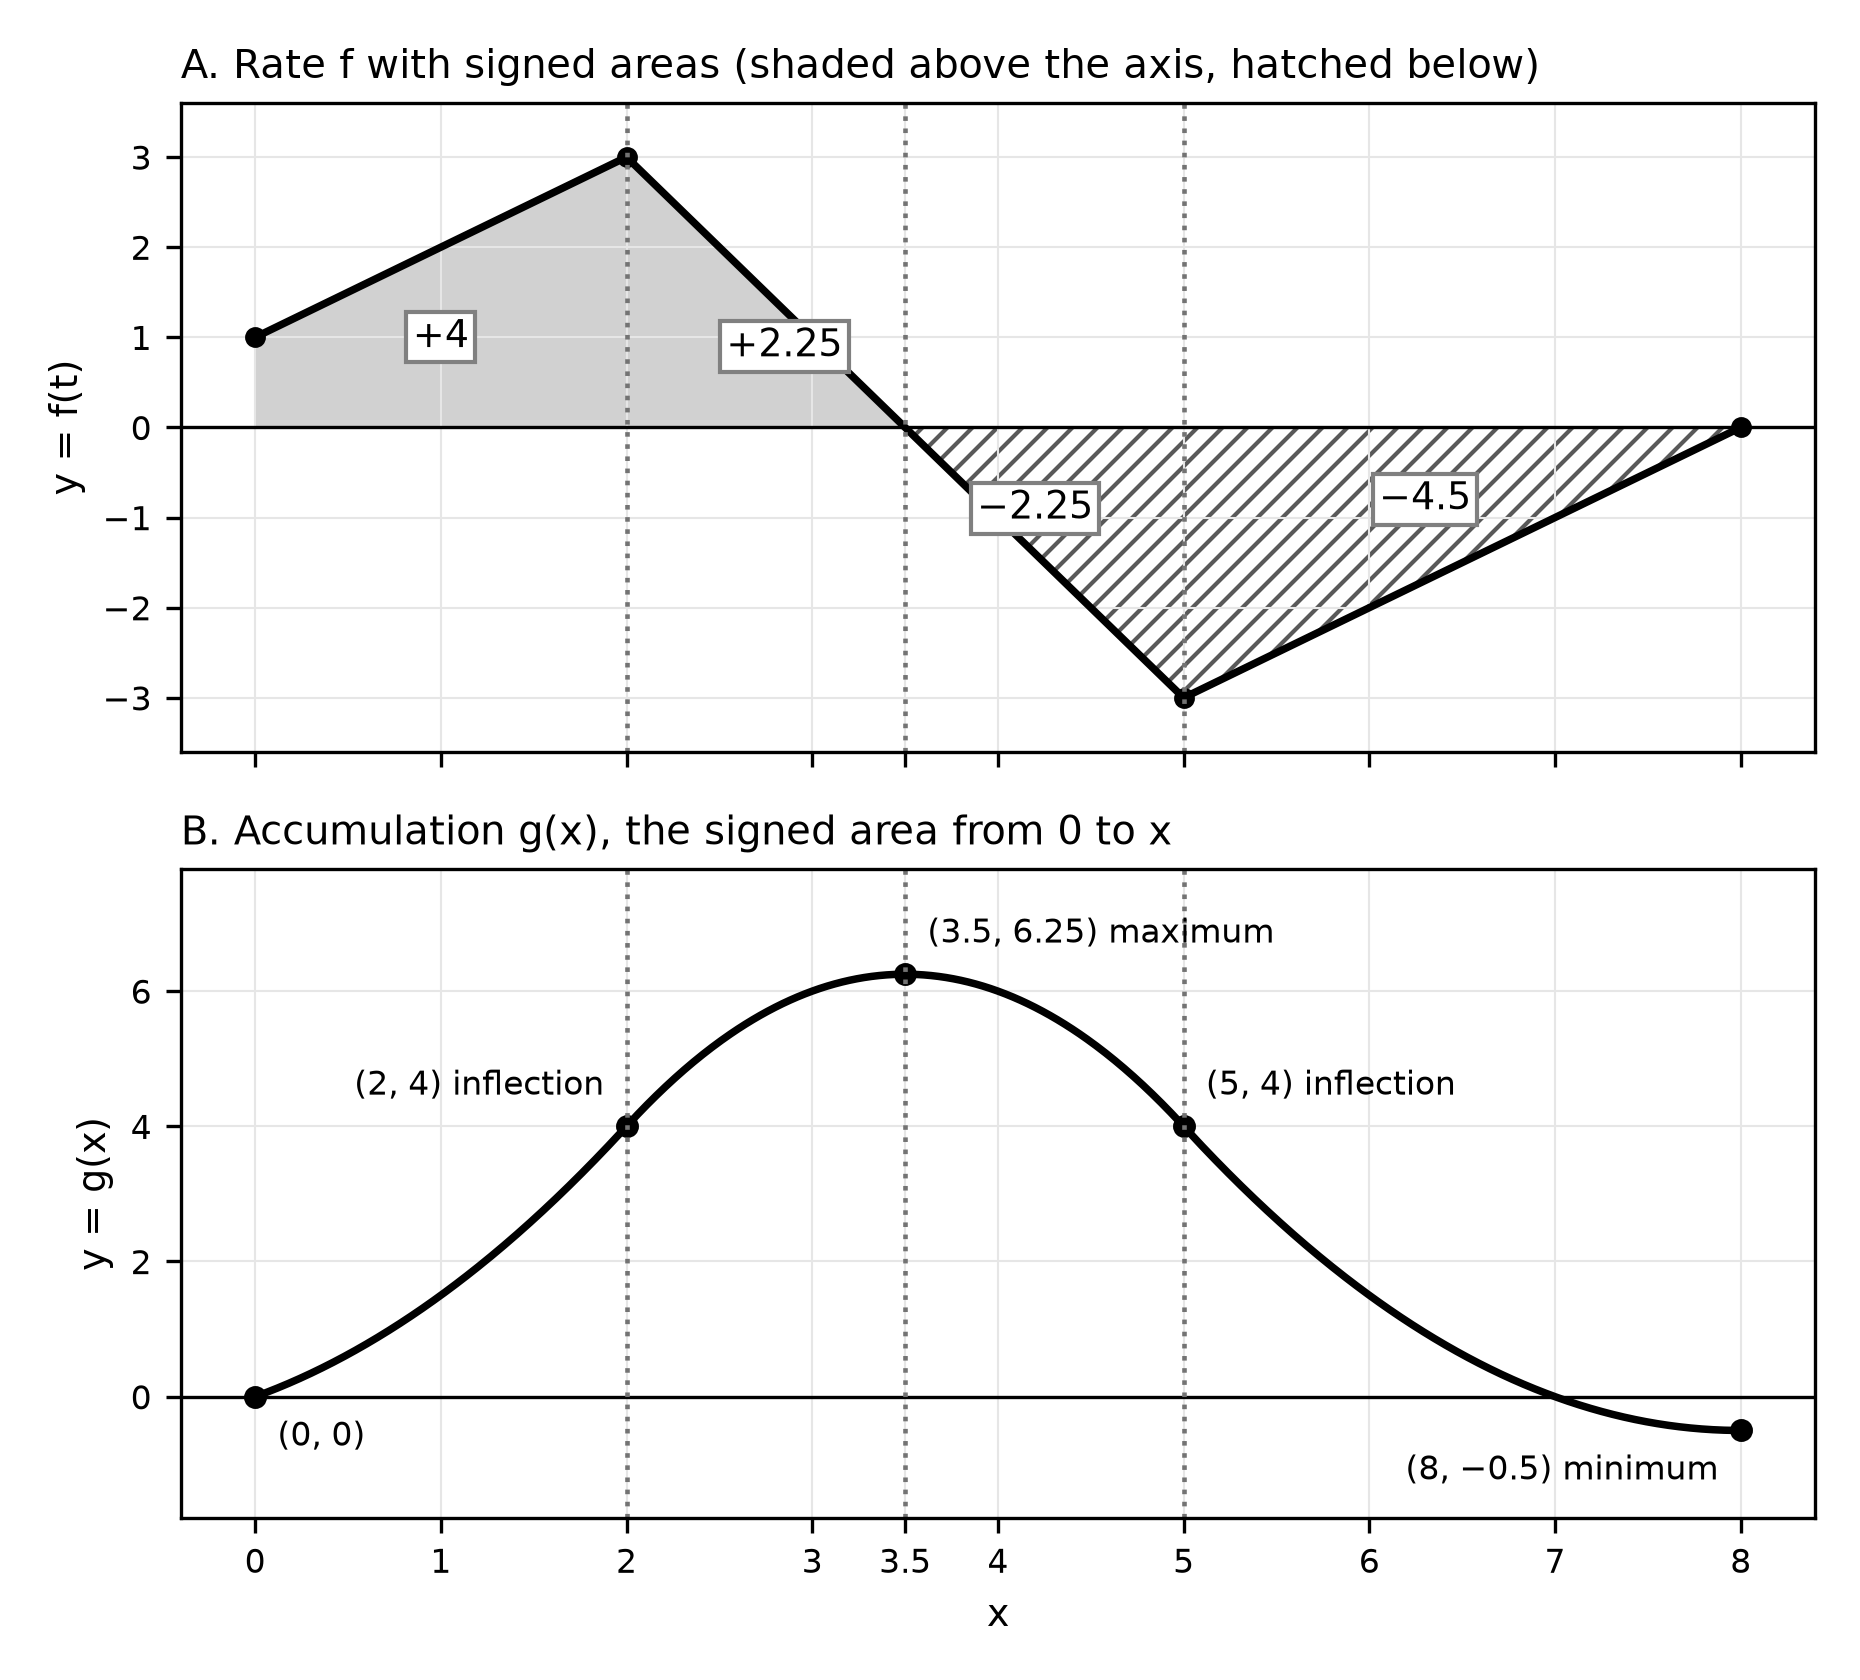
Figure 14.2. A rate graph and its accumulation function. Sign changes of become turning points of ; turning points of become inflection points of .
Try it
Try it 14.1. Water enters a tank at a rate liters per minute, with , , and . Use a trapezoidal sum with these subintervals to estimate the water added during the first 10 minutes, with units.
Solution. liters.
Try it 14.2. Write as a definite integral.
Solution. and on , so the limit is . An equivalent form is .
Try it 14.3. Find for and for .
Solution. Reverse the bounds of : . For , the chain rule gives .
Check your work
- Do the units of an accumulated amount equal the rate unit times the input unit?
- Did each Riemann term use its own subinterval width?
- Does every over/under claim rest on stated monotonic behavior?
- In a limit of sums, did you read , the start and before writing the bounds?
- In a derivative of an accumulation function, did you include the chain factor and the sign from a variable lower limit?
- When reading from a graph of , did you use the sign of for direction and the slope of for concavity?
Practice
This chapter's bank items are APCAL-C14-M01 to APCAL-C14-M16, printed after the companion panel as Questions 182–197, and the nine-point written tasks APCAL-C14-F01 and APCAL-C14-F02, printed as Written tasks 19 and 20. Questions 182–191 and Written task 20 are no-calculator work. Questions 192–197 and Written task 19 require a graphing calculator in radian mode; give decimals to the nearest thousandth. Answers, the error behind each wrong choice, rubrics and complete responses are in Answers, explanations and written responses, under Chapter 14: answers and explanations.
Review and retrieve
Wait two days. Then, without notes, recompute the three sums in Worked example 14.2 and redraw Figure 14.2B from Figure 14.2A alone. About a week later, mix this chapter with Chapter 12: for , use only the integrand to locate the relative extrema and the point of inflection of . Check: a relative maximum at , a relative minimum at , and an inflection point at .