What to practice
- Choose slices, intersections and signed differences for area
This chapter covers topics 8.4 to 8.6 of the course framework: area between curves written as functions of , written as functions of , and bounded by curves that cross more than twice. One routine handles all three: sketch, find the intersections, choose a slice, and integrate its length.
Area from a representative slice
Cut a region into thin strips. A vertical strip at position has width and a height equal to the distance from the bottom boundary to the top boundary, so its area is about . Adding the strips and letting their width shrink gives an integral:
Every area problem therefore asks three things. Which way do the slices run? Where does the region start and stop in that direction? What is the length of one slice? Area is never negative. If your setup produces a negative number, the subtraction or the limits are backward.
Chapter 19 treated a single integral as signed accumulation. Here we want geometric area, so we make each slice length positive before integrating.
Use the shape of the region to choose the slice:
| What the sketch shows | Slice to try first |
|---|---|
| The top and the bottom are each one function of | Vertical, with |
| The left and the right are each one function of | Horizontal, with |
| The top or the bottom changes partway across | The other direction, or split the interval |
| A boundary is given as in terms of | Horizontal, or solve for first |
Sketch before you choose. A quick graph also shows which curve is on top, and how many times the curves cross.
Vertical slices: top minus bottom
When the top and bottom boundaries are each a single function of , integrate with respect to . The limits are the -coordinates where the region begins and ends, usually intersections.
Worked example 20.1: a parabola and a line
Find the area of the region between and .
Intersections. Set : , so and or .
Top and bottom. Test , between the intersections: the parabola gives 4 and the line gives 2, so the parabola is on top (Figure 20.1).
Integrate.
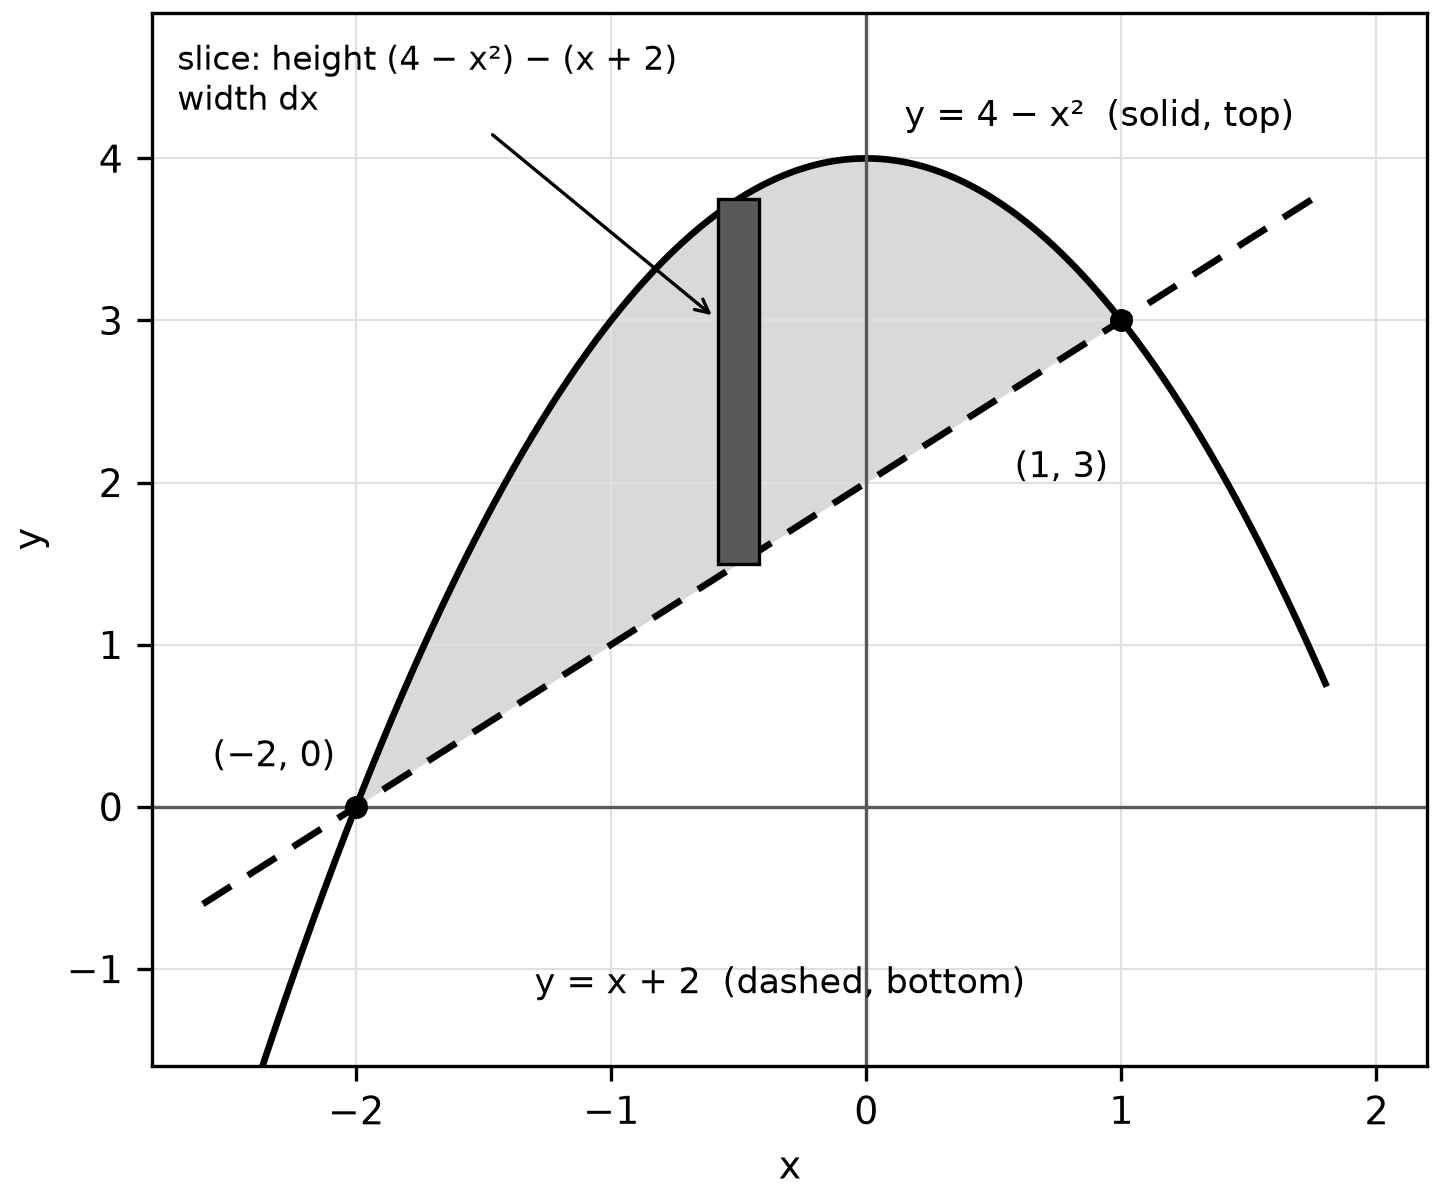
Figure 20.1. One vertical slice of the region. Its height is top minus bottom; its width is .
Worked example 20.2: estimate an area from measurements
A surveyor measures the north and south shores of a pond from a straight east–west reference line, at five positions meters along it (constructed practice data):
| (meters) | 0 | 20 | 40 | 60 | 80 |
|---|---|---|---|---|---|
| north shore (meters) | 12 | 28 | 34 | 25 | 9 |
| south shore (meters) | 12 | 10 | 8 | 11 | 9 |
Representation change. No formula is given, but the area is still . Top minus bottom becomes a new row: widths 0, 18, 26, 14 and 0 meters. A trapezoidal sum with equal spacing 20 estimates the integral:
The pond covers about 1160 square meters, because meters times meters give square meters. Subtracting first keeps the slice idea visible. Separate trapezoidal sums for each shore, subtracted afterward, give the same 1160 here because both use the same -values.
Check the size. No width exceeds 26 meters, so the area is less than square meters, and 1160 is plausible. A table cannot show how the shores curve between readings, so the estimate's error is unknown.
Horizontal slices: right minus left
Some regions are bounded by curves written as in terms of . Slice them horizontally. A horizontal strip at height has thickness and length :
The limits are now -values. Using the -coordinates of intersection points as limits is one of the most common setup errors in this unit.
Worked example 20.3: choose the slicing direction
Find the area of the region between and .
Intersections. gives or , at the points and .
Method choice. Look at Figure 20.2. Every horizontal slice runs from the parabola on the left to the line on the right, so one integral in works:
Vertical slices also work, but the bottom boundary changes at . The top is always ; the bottom is for and for . That route needs two integrals,
The same area, with more work and more chances to slip. Choose the direction in which one formula describes every slice.
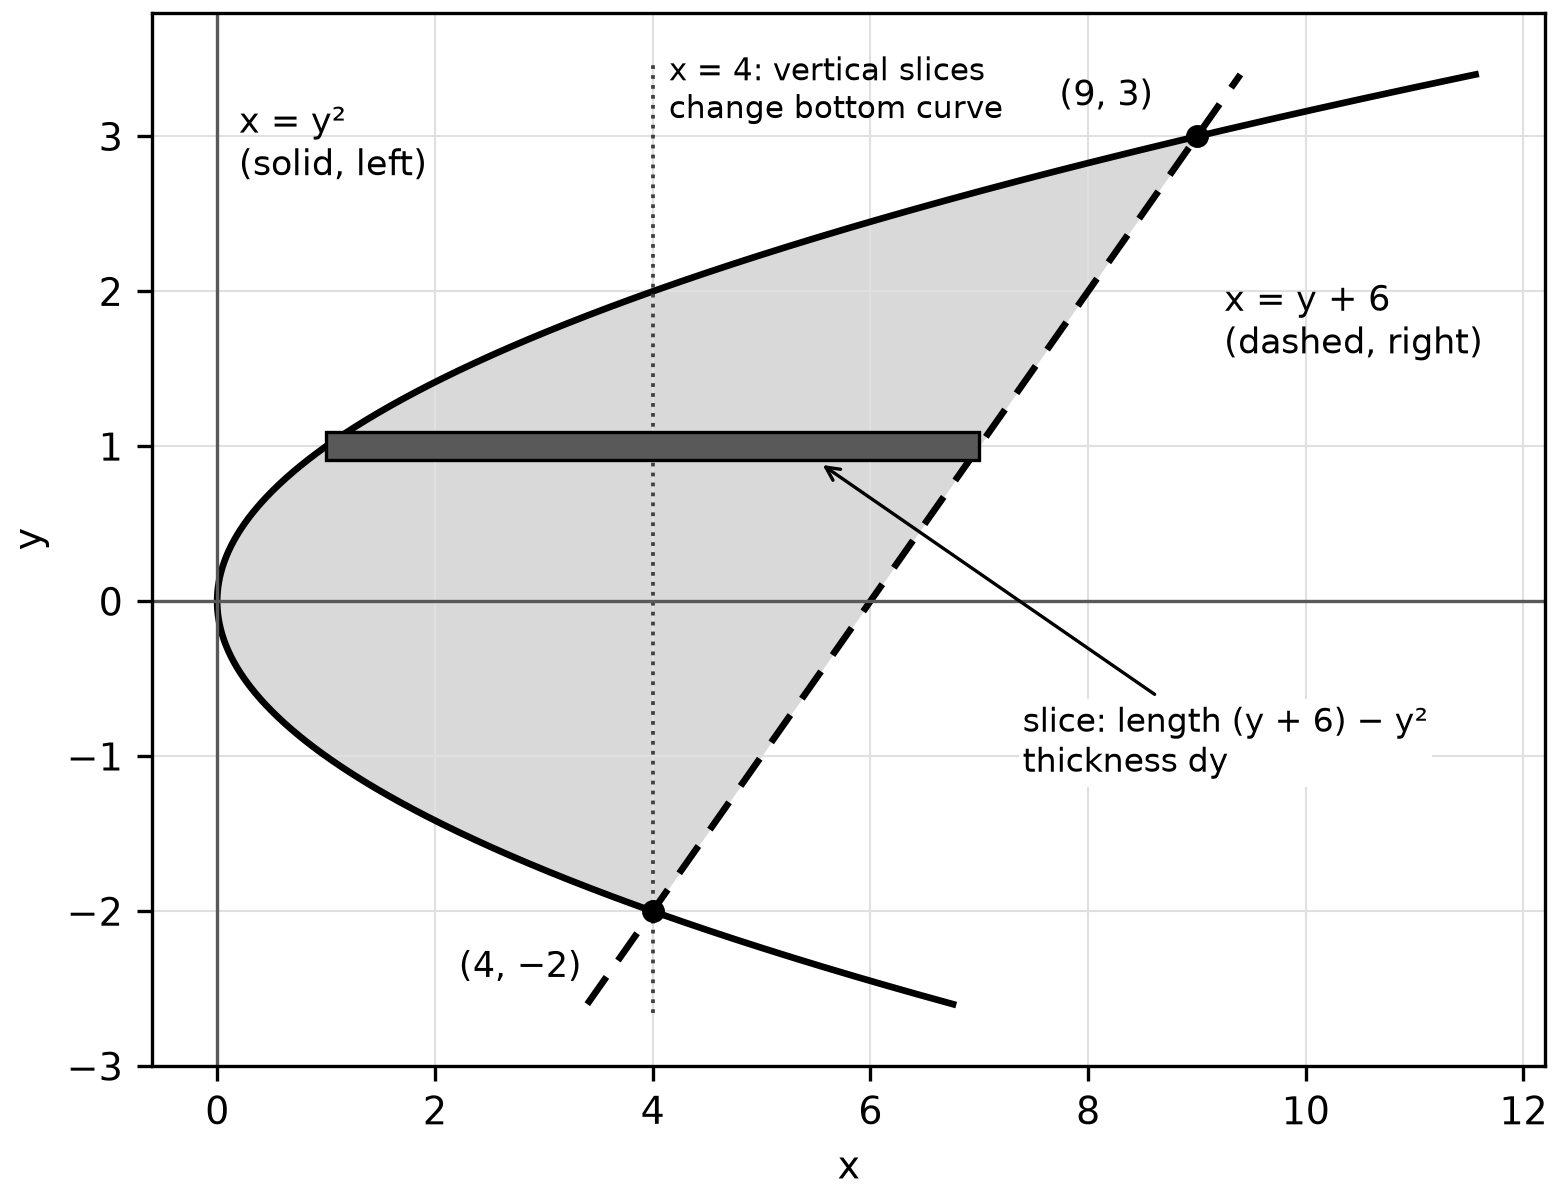
Figure 20.2. Horizontal slices all run from to . Vertical slices change their bottom boundary at .
Worked example 20.4: diagnose a horizontal-slice error
Task: find the area between and . A student wrote:
"They meet at and . Area ."
The integrand, right minus left, is correct. The limits are not: 1 and 4 are -coordinates, but the variable is . The negative result was a warning the student ignored. Repair: the -values of the intersections are and 2, so
Log this as REPRESENTATION: a coordinate was read on the wrong axis.
Three checks catch most setup errors before you integrate:
- The limits belong to the variable of integration: -values with , -values with .
- One formula for the slice length holds across the whole interval; otherwise, split.
- The answer is positive and fits the sketch. Here the region lies inside a box 4 units wide () and 3 units tall (), so its area must be less than 12.
Curves that cross more than twice
When two curves cross inside the interval, top and bottom trade places. The area is the integral of the distance between the curves,
Without a calculator, split the interval at every crossing and subtract the lower function from the upper one on each piece. With a calculator, you may enter the absolute value directly.
To find the pieces, study the single function . Its zeros are the crossings, and its sign on each piece says which curve is on top: positive means is above. Factor when you can, and test one point in each piece. A graph of suggests where the zeros are, but it cannot prove that no others exist.
Worked example 20.5: split at every crossing
Find the total area between and .
Crossings. , which is zero at , 0 and 2.
Which is on top? At , , so is above on . At , , so is above on (Figure 20.3).
Integrate each piece.
The total area is . A single integral, , is not the area: the pieces partly cancel.
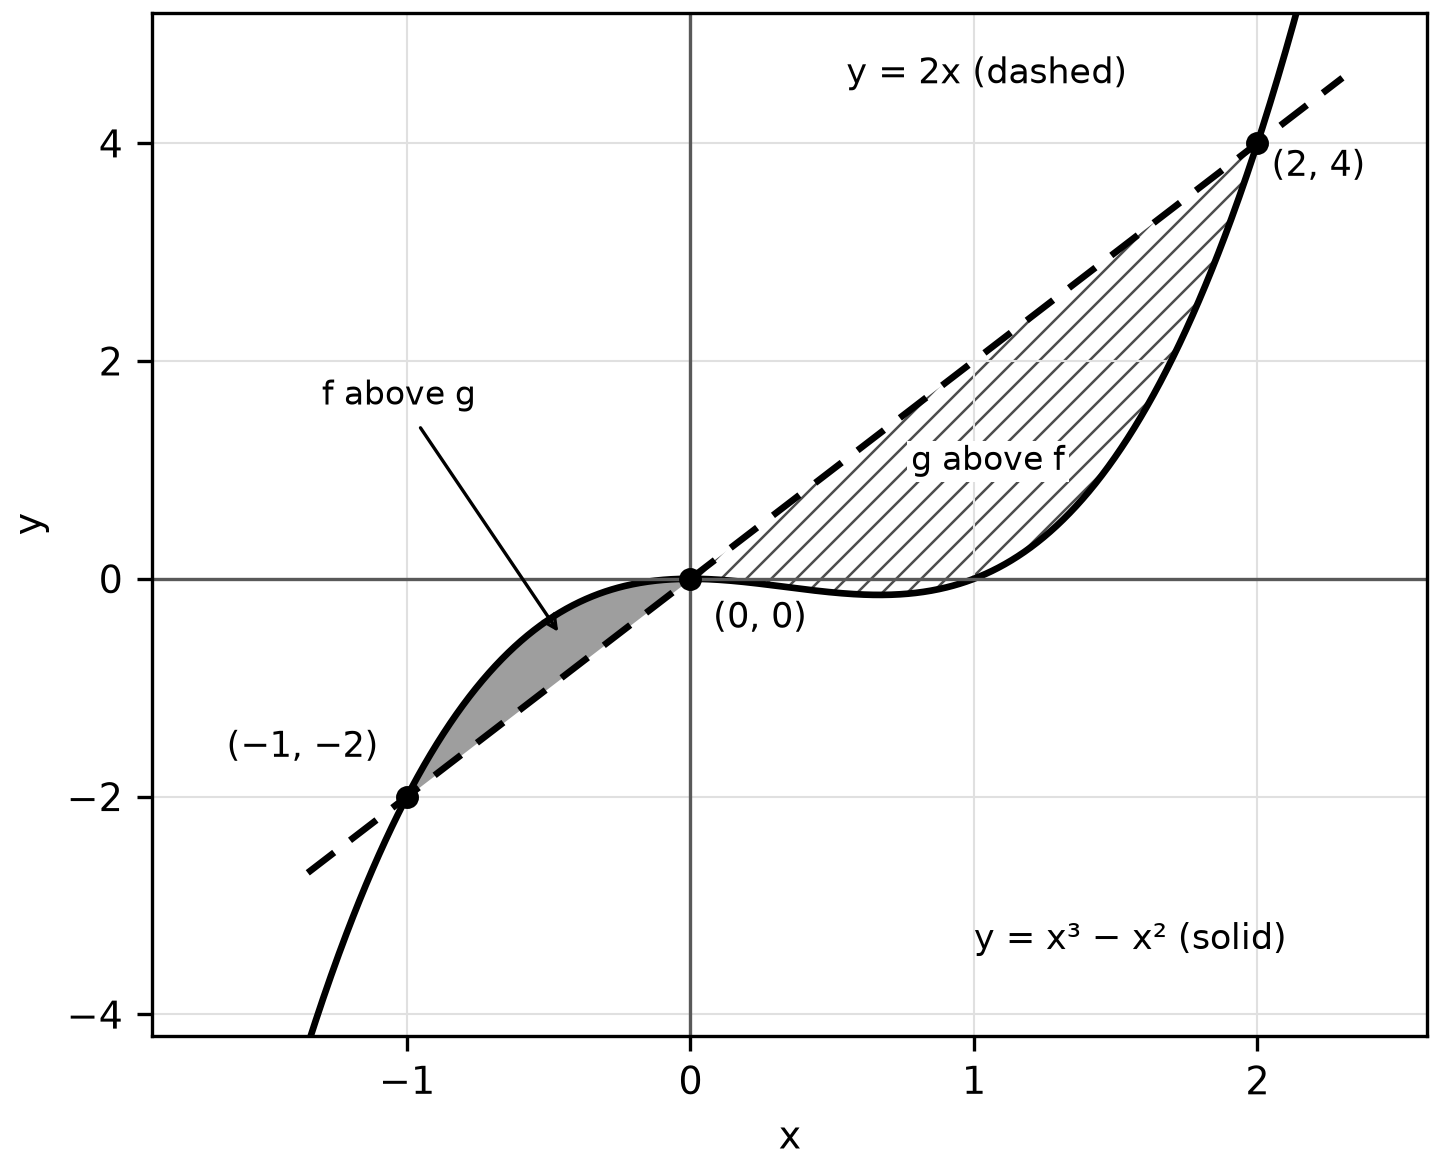
Figure 20.3. Three crossings create two regions with different top curves. Each piece is integrated as top minus bottom.
Worked example 20.6: a calculator area with stored intersections
Find the area of the region between and , to three decimal places.
The equation has no algebraic solution, so solve it numerically. A graph shows two crossings, symmetric about the -axis; store them as and . There are no others: for , . Between them, , so the cosine curve is on top. Write the setup, then the value:
Use the stored values. Typing the rounded bounds gives about 1.093, wrong in the third decimal. Both functions are even, so the area also equals , a quick check on the value. On a free-response question, show the integral with its limits before the number; the calculator result alone does not show your setup.
Try it
Try it 20.1. Find the area between and .
Try it 20.2. Find the area of the region bounded by and . Choose the slicing direction that needs one integral.
Try it 20.3. For and on , find the total area between the curves and the value of . Explain why they differ.
Check your work
20.1. The curves meet where , at , and is on top. Area .
20.2. Slice horizontally. The curves meet where , at , and the line is on the right: .
20.3. The curves cross at . Area . The signed integral is : on , where , the piece counts as instead of .
Retrieve and review
- In two days. From a blank page, sketch the region of Example 20.3 and set up its area both ways. Then explain in one sentence why the vertical setup needs two integrals.
- In one week. Rework any question below that you missed, and log its code: GEOMETRY for a wrong top curve or slice, REPRESENTATION for limits read on the wrong axis, PRECISION for rounded intersections.
- Mixed review. Return to Chapter 19's five-row table. Which row matches ? (The third: it counts every piece as positive.)
Practice
Chapter 20's practice is items APCAL-C20-M01 to APCAL-C20-M12 and the written task APCAL-C20-F01, printed after this chapter's companion panel as Questions 253–264 and Written task 28. Questions 253–256, Questions 258–261 and Written task 28 are no-calculator work. Questions 257 and 262–264 require a graphing calculator in radian mode; give decimals to the nearest thousandth. Answers, the error behind each wrong choice, the rubric and a complete response are in Answers, explanations and written responses, under Chapter 20: answers and explanations.