What to practice
- Interpret growth/decay, equivalent expressions and rates across different input intervals.
A sample loses one tenth of its mass every hour. A membership list grows by 3.5 percent every month. Both statements describe the same structure: equal steps in the input multiply the output by the same factor. Chapter 7 built that idea from sequences, where the inputs were counting numbers. This chapter extends it to every real input, then shows how to read an exponential function's behavior and how to rewrite it so that its base describes the time interval a question actually asks about.
Keep two questions in front of you throughout. What does each number in the formula measure, and over what input interval does that measurement apply?
The general form and what each parameter promises
An exponential function in general form is
with two conditions: , and the base satisfies and . The number is the initial value because . The base is the factor for one unit of input: increasing by 1 multiplies the output by . When the inputs are natural numbers, the input simply counts how many factors of are applied to . The domain, however, is all real numbers, so has a meaning even though "two and a half factors" does not.
When and , the function shows exponential growth. When and , it shows exponential decay. The base must be positive so that values such as are real, and it cannot equal 1 because never changes.
The defining property is proportional change over equal-length input intervals. For any input and any step ,
The ratio depends on the length of the step, not on where it starts. A linear function has equal differences over equal intervals; an exponential function has equal ratios. This is the test to apply to a table before you choose a formula.
Worked example 8.1: a table with steps of two
A constructed table gives , , and . Is consistent with an exponential model, and what is its rule?
- Check the spacing. The inputs rise by 2 each time, so ratios over these steps are comparable.
- Compute ratios. Each output divided by the previous one gives exactly 1.21. Equal ratios over equal steps support an exponential model.
- Convert to one unit. The ratio 1.21 belongs to a two-unit step, so . Because the base must be positive, .
- Read the initial value. The table includes , so and .
- Check a point you did not use. , which matches.
The tempting wrong rule is . It gives 60.5 at , a full step early, because it treats a two-unit ratio as a one-unit factor.
Read behavior from the formula and the graph
Because each equal step multiplies by the same factor, an exponential function in general form is always increasing or always decreasing, and its graph is always concave up or always concave down. It therefore has no maximum or minimum on an open interval and no point of inflection. On a closed interval, its extreme values occur at the endpoints.
Use both parameters to decide behavior, not the base alone:
| Sign of | Base | Behavior | Concavity |
|---|---|---|---|
| increasing | concave up | ||
| decreasing | concave up | ||
| decreasing | concave down | ||
| increasing | concave down |
The end behavior has one unbounded side and one side that approaches 0. For , outputs increase without bound as increases and get arbitrarily close to 0 as decreases, so the line is a horizontal asymptote. Adding a constant moves that asymptote: approaches on one side. The shift also changes the range. If , the range of is all outputs greater than , not all outputs greater than 0.
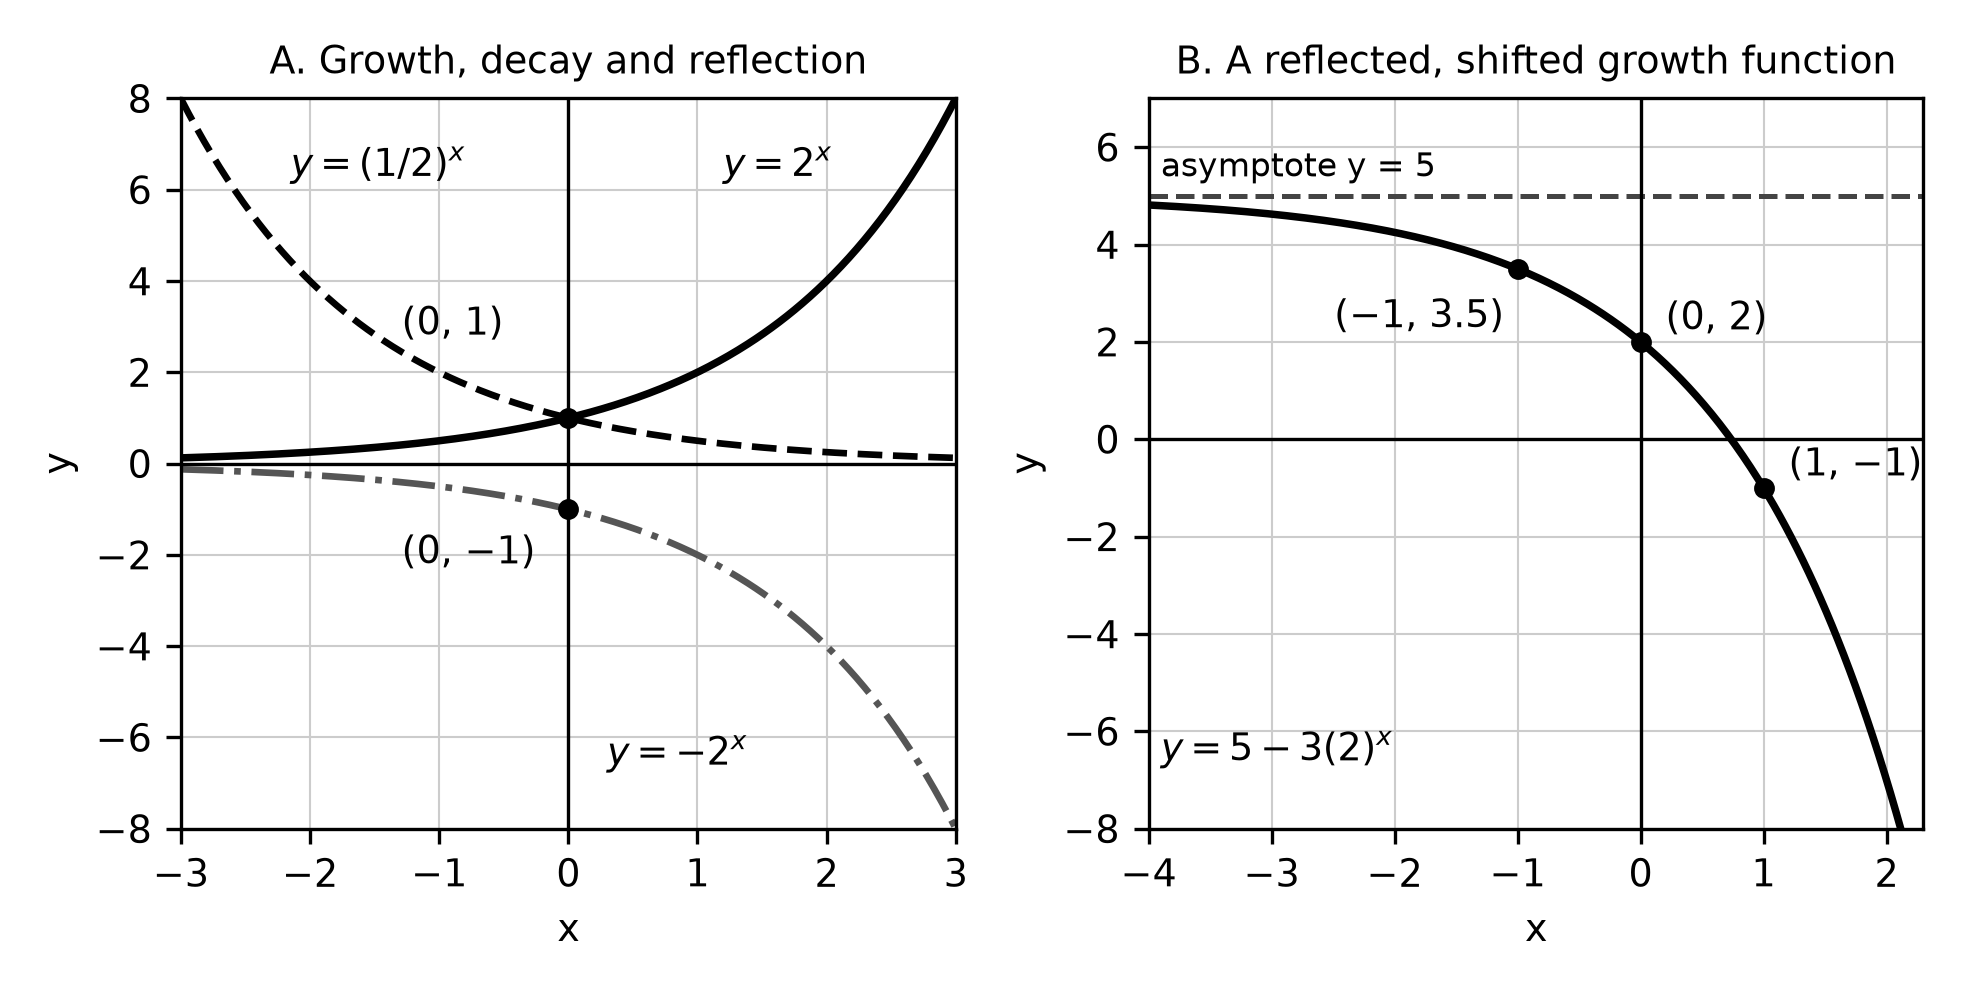
Figure 8.1. Panel A compares growth, decay and a reflection across the x-axis. Panel B shows an additive transformation: the asymptote moves to . Original graph.
Worked example 8.2: features of a reflected, shifted function
Describe , shown in Figure 8.1B.
Rewrite it as , so , and . Since increases, multiplying by makes decreasing, and the graph is concave down. As decreases, approaches 0, so approaches 5 from below; as increases, decreases without bound. The range is all outputs less than 5. Check with values: , , . The outputs fall, and the drops of 1.5 and 3 grow larger, which matches concave down. A student who reads "base 2, so growth" has ignored the sign of .
Worked example 8.3: a pattern hidden by a constant
A constructed record of a cooling drink in a 20 °C room gives 90, 62, 45.2 and 35.12 °C at 0, 5, 10 and 15 minutes. The raw ratios are about 0.689, 0.729 and 0.777, so the temperatures are not proportional. Subtract the room temperature: the differences 70, 42, 25.2 and 15.12 have a constant ratio of 0.6 per 5 minutes. The output values of are proportional, so is an additive transformation of an exponential function:
Check: . The model's asymptote is the room temperature, which is the level the drink approaches but does not pass.
Rewrite exponential expressions for a purpose
Equivalent forms reveal different facts about the same function. Four exponent properties do the work.
- Product property: . A horizontal translation of an exponential function is the same as a vertical dilation. For example, .
- Power property: . A horizontal dilation is the same as changing the base. For example, .
- Negative exponents: , so and are the same function.
- Unit-fraction exponents: for a natural number , is the $k$th root of . For example, .
Worked example 8.4: a shift that is really a stretch
Show that and are the same function.
By the product property, , so . Both are defined for all real , so the functions are equal, not merely similar. Check one input: and . Shifting the graph of three units left produces exactly the same curve as stretching it vertically by a factor of 8. The common error is to write , which adds 3 to the output instead of multiplying by 8.
Worked example 8.5: a factor that belongs to two hours
A constructed model gives the mass of a tracer, in milligrams, hours after it is prepared:
What is the hourly percent decrease?
The exponent counts two-hour periods, so 0.81 is the factor per two hours: a 19% decrease every two hours. Use the power property to find the hourly factor:
The hourly factor is 0.9, a 10% decrease each hour. Two common shortcuts fail. Reading 19% as the hourly rate ignores the interval. Halving 19% to get 9.5% treats multiplicative change as additive. Check with repeated multiplication: , but .
Check both forms at a new input. At , and . Figure 8.2 shows the two step sizes on one curve. On the mass approaches 0 without reaching it, so a statement such as "the tracer is gone after 30 hours" is not a prediction of this model.
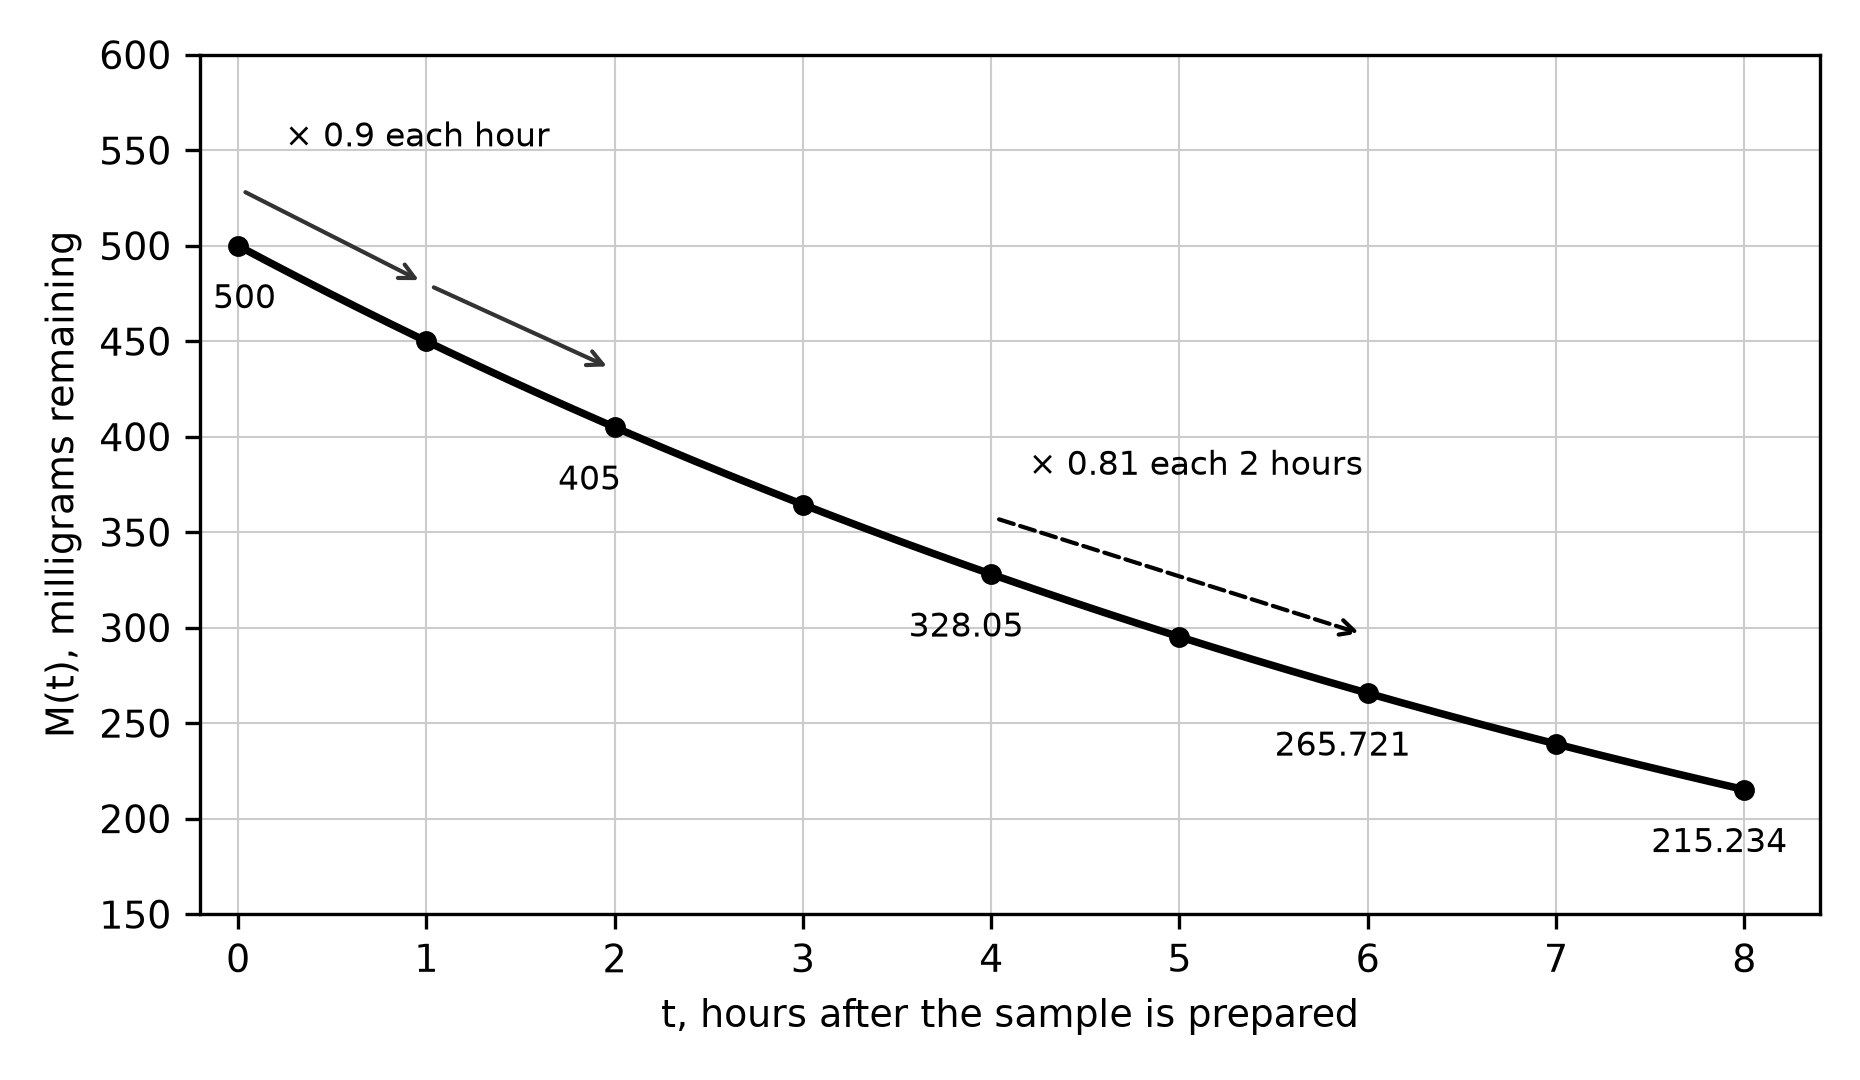
Figure 8.2. One function measured with two step sizes. The one-hour factor applied twice equals the two-hour factor. Original graph of a constructed model.
Worked example 8.6: converting monthly and yearly rates
A balance grows by 2% per month, so its monthly factor is 1.02. The yearly factor is , an increase of about 26.8% per year. Multiplying 2% by 12 gives 24%, which misses the growth on earlier growth. In reverse, if a quantity grows by 50% per year, its monthly factor is , about 3.44% per month rather than %. Keep the unrounded factor in your calculator and round only the final percent.
Errors to catch before they cost points
- Base alone decides growth. Check the sign of . The function is increasing.
- First listed value is the initial value. The initial value is . If a table starts at , divide by the base to step back.
- A shift written as a sum. equals , not .
- Percent per interval divided or multiplied. Convert factors with roots and powers, then convert the factor to a percent.
- Range ignores the shift. For , the boundary of the range is .
Guided attempt
A constructed model for the area of a plant mat, in square meters, is , where is weeks since monitoring began.
- The exponent tells you that 1.44 is a factor per ______ weeks.
- Rewrite: .
- State the weekly percent increase and check both forms at .
Check your reasoning. The factor 1.44 applies to two-week periods. The weekly factor is , a 20% weekly increase, not 22%. At , and .
Independent check
An exponential function satisfies and . Without a calculator, (a) decide whether shows growth or decay, (b) write in the form , (c) find , and (d) evaluate a classmate's claim that " loses 75% of its value each unit."
Model reasoning. The ratio over the two-unit step is , so . The base of an exponential function is positive, so , not . Then , so , which is decay because and . Next, . The classmate described the two-unit change: loses 75% over two units but 50% over one unit.
Retrieval and review
Close the book and write the general form, the conditions on and , and what each parameter measures. At your next study session, redo Worked example 8.5 with a factor of 0.64 per two hours and explain the result in a sentence that names the interval. About a week later, take one function from Figure 8.1 and describe its increase or decrease, concavity, asymptote and range without looking. Record any error with the step where it began. Chapter 9 uses these ideas to build models from data, and Chapters 11 and 12 add logarithms, which solve for an unknown exponent without a graph.
Practice
Attempt the printed Chapter 8 practice set before reading any solution. It contains twelve multiple-choice questions, Questions 129–140, followed by Written task 6.
- No calculator: Questions 129–136. Use exact values and exponent properties.
- Graphing calculator required: Questions 137–140 and Written task 6. Keep unrounded values and report decimal answers correct to three places unless a question says otherwise.
Allow about 25 minutes for the multiple-choice questions and 15 minutes for the written task, then check your work in "Chapter 8: answers and explanations" in the answer section. For each miss, use the repair note printed with the explanation and return to the named heading before trying a fresh question.