What to practice
- Choose graph windows, tables, roots, intersections, regression and precision deliberately.
A graphing calculator answers the question you give it. It cannot decide which question matters, whether its screen shows every feature, or whether a number makes sense in context. This chapter builds a habit that makes calculator work trustworthy.
Know when the calculator belongs to the exam
On the May 2027 exam, a graphing calculator is required in Part I-B (13 multiple-choice questions) and Part II-A (free-response questions 1 and 2). It is not permitted in Part I-A (29 questions) or Part II-B (questions 3 and 4) (exam format). Bluebook supplies its built-in Desmos graphing calculator only during the calculator-required parts. You may also bring up to two approved handheld graphing calculators. The public Desmos website and app are study tools; they cannot be used during the exam (calculator policy). Practice on the tool you will actually use, in radian mode, as the course description instructs.
The course description lists the capabilities you need: graphs, tables, real zeros, intersections, extrema, numerical equation solving, and regressions with residual plots. Only some Part I-B questions require the calculator, so do short algebra by hand even there.
Follow a five-step workflow
- State the question in mathematics. Write the equation, feature or model you need, with its domain and units.
- Predict. Use degree, end behavior, signs or context to estimate how many answers to expect and roughly where.
- Enter carefully. Put parentheses around numerators, denominators and exponents, confirm radian mode, and type the original expression rather than a rewritten one.
- Choose an informative window, then find the zero, intersection, extremum, table value or regression.
- Interpret. Say what the number means, with units, and check it against the domain and your prediction.
A scorer reads mathematics, not keystrokes. Write " when ," not "used the zero tool." Unless a question says otherwise, report decimals accurate to three places after the decimal point and avoid rounding intermediate values; the course description's free-response instructions say both. Store computed values instead of retyping rounded ones.
Demonstration 18.1: find every zero
Task. Find all real zeros of .
Prediction. A cubic has at most three real zeros. Its leading coefficient is positive, so grows without bound as increases.
Calculator work. In a window from −10 to 10 on both axes, the graph crosses the -axis near −4.094 and 2.746, then leaves the bottom of the screen. Is that all? Evaluate . The output is negative at but must eventually become positive, so a third zero lies beyond 10. Widening the window to and shows it at .
Answer. The zeros are , and . A cubic has at most three, so the algebraic count, not the picture, proves the list complete.
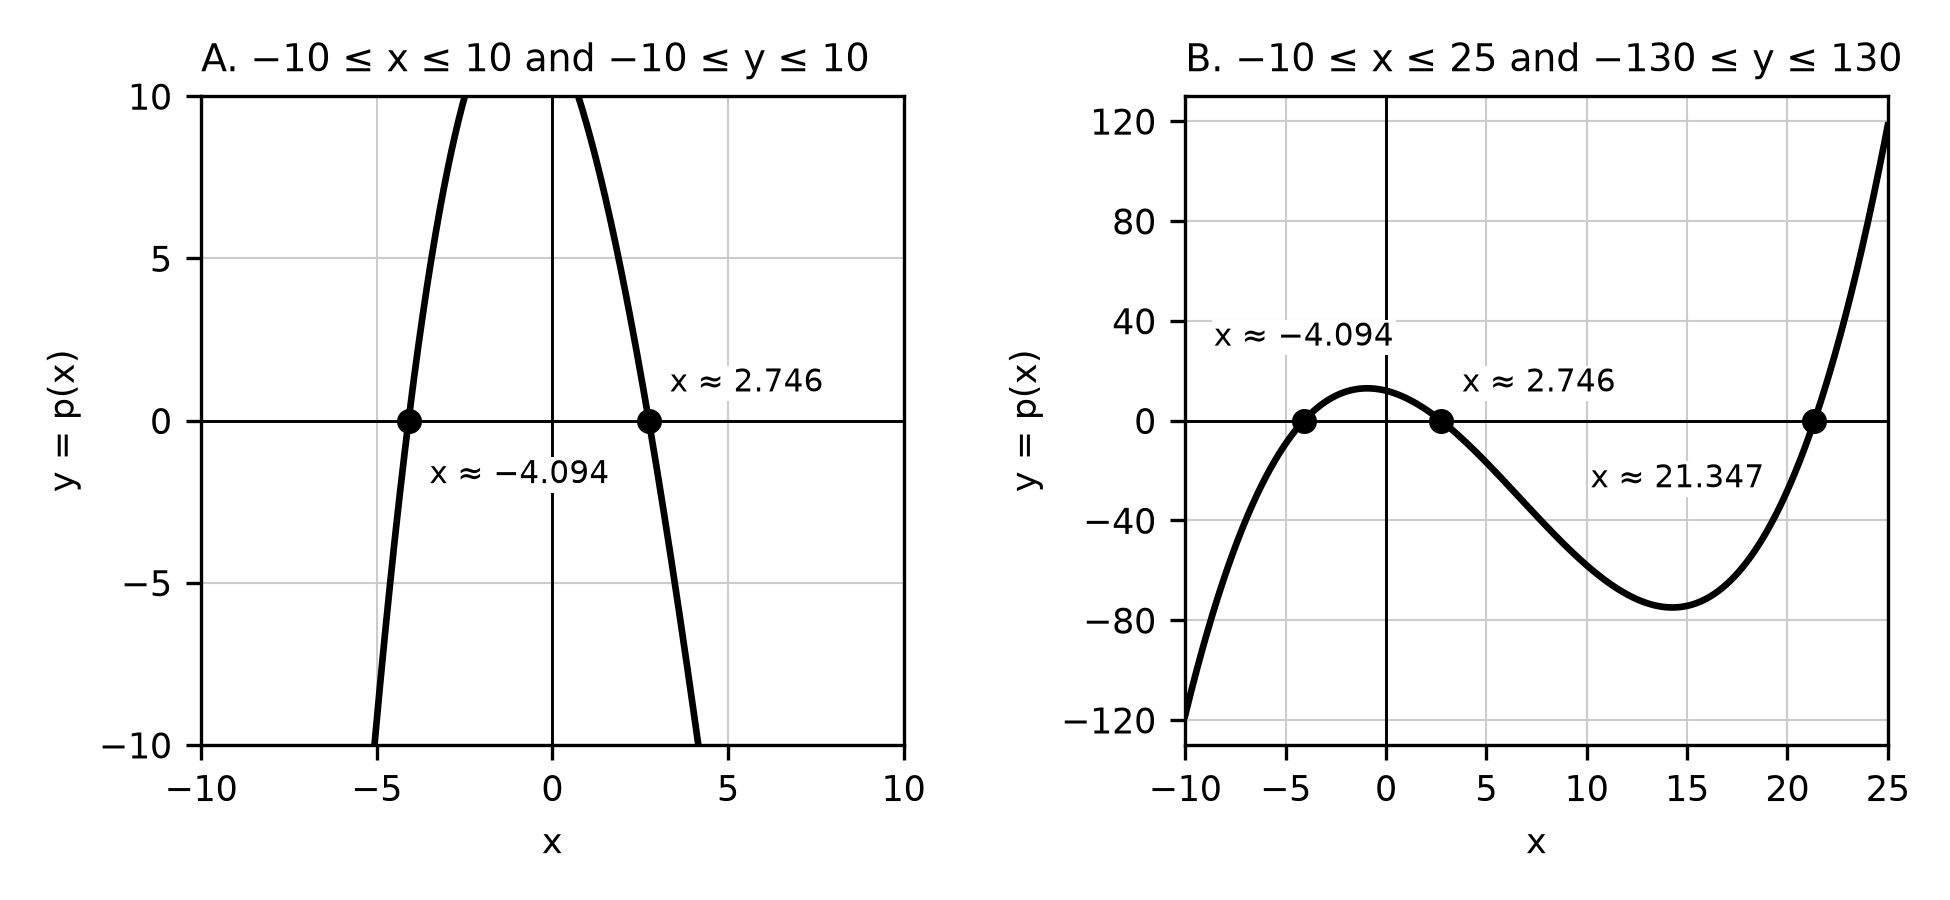
Figure 18.1. The function in two windows. The narrow window hides the third zero; the sign of and the end behavior say it must exist.
Demonstration 18.2: an intersection the original equation does not have
Task. Solve .
Setup. Both logarithms require positive arguments, so the domain is .
Calculator work. A student who first rewrites the left side as and graphs it with sees two intersections, at and . Graphing the original left side shows only one, because that expression is undefined for .
Answer. , exactly . The rewritten expression agrees with the original only on the original domain; outside it they are different functions. The calculator graphs exactly what you type, so enter the original form and check each candidate in the original equation.
Demonstration 18.3: a labeled maximum may not be the greatest value
Task. In a constructed model, the depth of water in a holding tank is feet, hours after a valve opens, for . Find the greatest depth.
Calculator work. Restrict the graph to the model's domain; in Desmos, type the condition in braces after the expression. The graph has a local maximum at and a local minimum at . The domain includes its endpoints, so evaluate them too: and .
Answer. The greatest depth is 32 feet, at hours. The local maximum is highest only among nearby inputs. A calculator does not know which inputs your context allows unless you tell it.
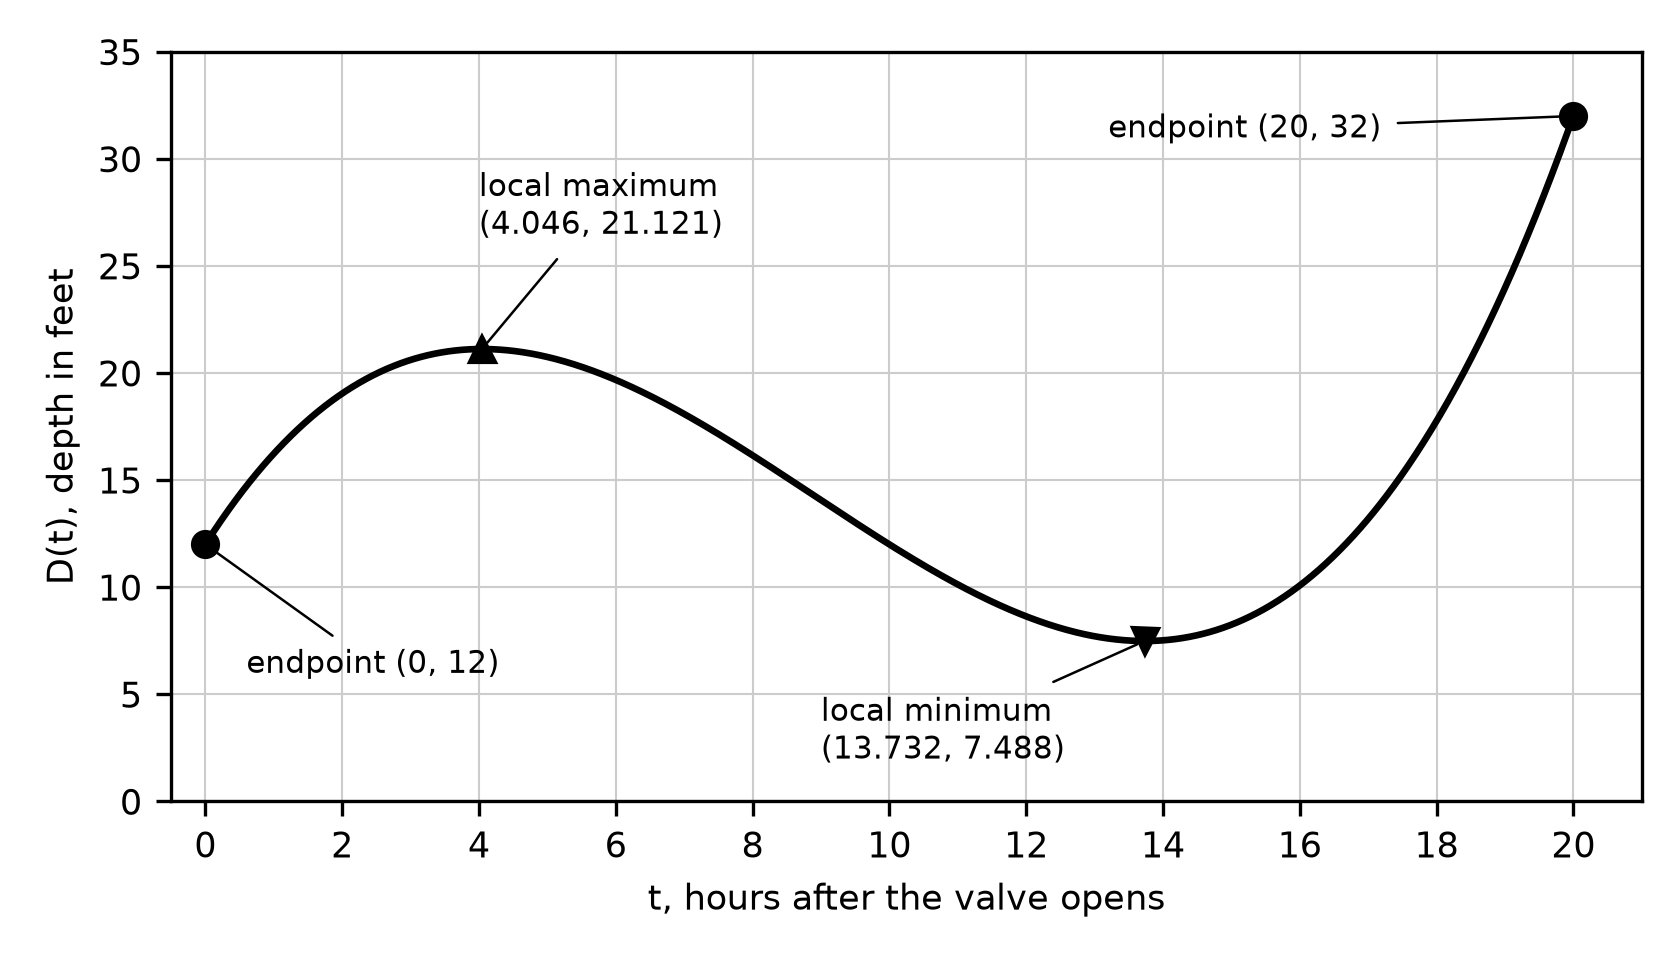
Figure 18.2. The constructed tank model on its closed domain. The right endpoint, not the labeled local maximum, gives the greatest depth.
Demonstration 18.4: use a table for whole-number inputs
Task. A constructed model gives a club's membership after whole months as . In which month does membership first exceed 1,000?
Calculator work. The graphs of and intersect at , but 10.848 is not a month count. A table settles it: and .
Answer. Month 11. The intersection located the change; the table answered for whole-month inputs.
Demonstration 18.5: regression, residuals and the limits of a model
The table gives constructed practice data: registered users of a new school study app at the end of week .
| Week | 0 | 1 | 2 | 3 | 4 | 5 | 6 |
|---|---|---|---|---|---|---|---|
| Users | 148 | 199 | 259 | 346 | 452 | 596 | 784 |
Compare two models. A linear regression gives with correlation . That strong-looking hides a problem. A residual is the actual value minus the predicted value. The linear residuals are positive, then negative for weeks 2 to 5, then positive again: a curved pattern showing that the line misses systematically. An exponential regression gives , and its residuals are each smaller than 3 users and show no curved pattern. The exponential model is the better choice for these weeks.
Interpret. The factor means users grew by about 31.7% per week over the observed weeks. At week 3 the residual is : the model underestimates by about 2.650 users.
Store, don't retype. To find when the model reaches 500 users, solve with the stored values of and : weeks. Retyping gives 4.337, which fails three-decimal accuracy. Desmos fits exponential models to the original data by default; its log mode, like a TI calculator's exponential regression, fits logarithms instead and gives here (Desmos log mode). State which method you used.
Limit. The model is supported only from week 0 to week 6. At week 30 it predicts about 583,110 users, more than any school could supply. Small residuals inside the data say nothing about weeks outside it.
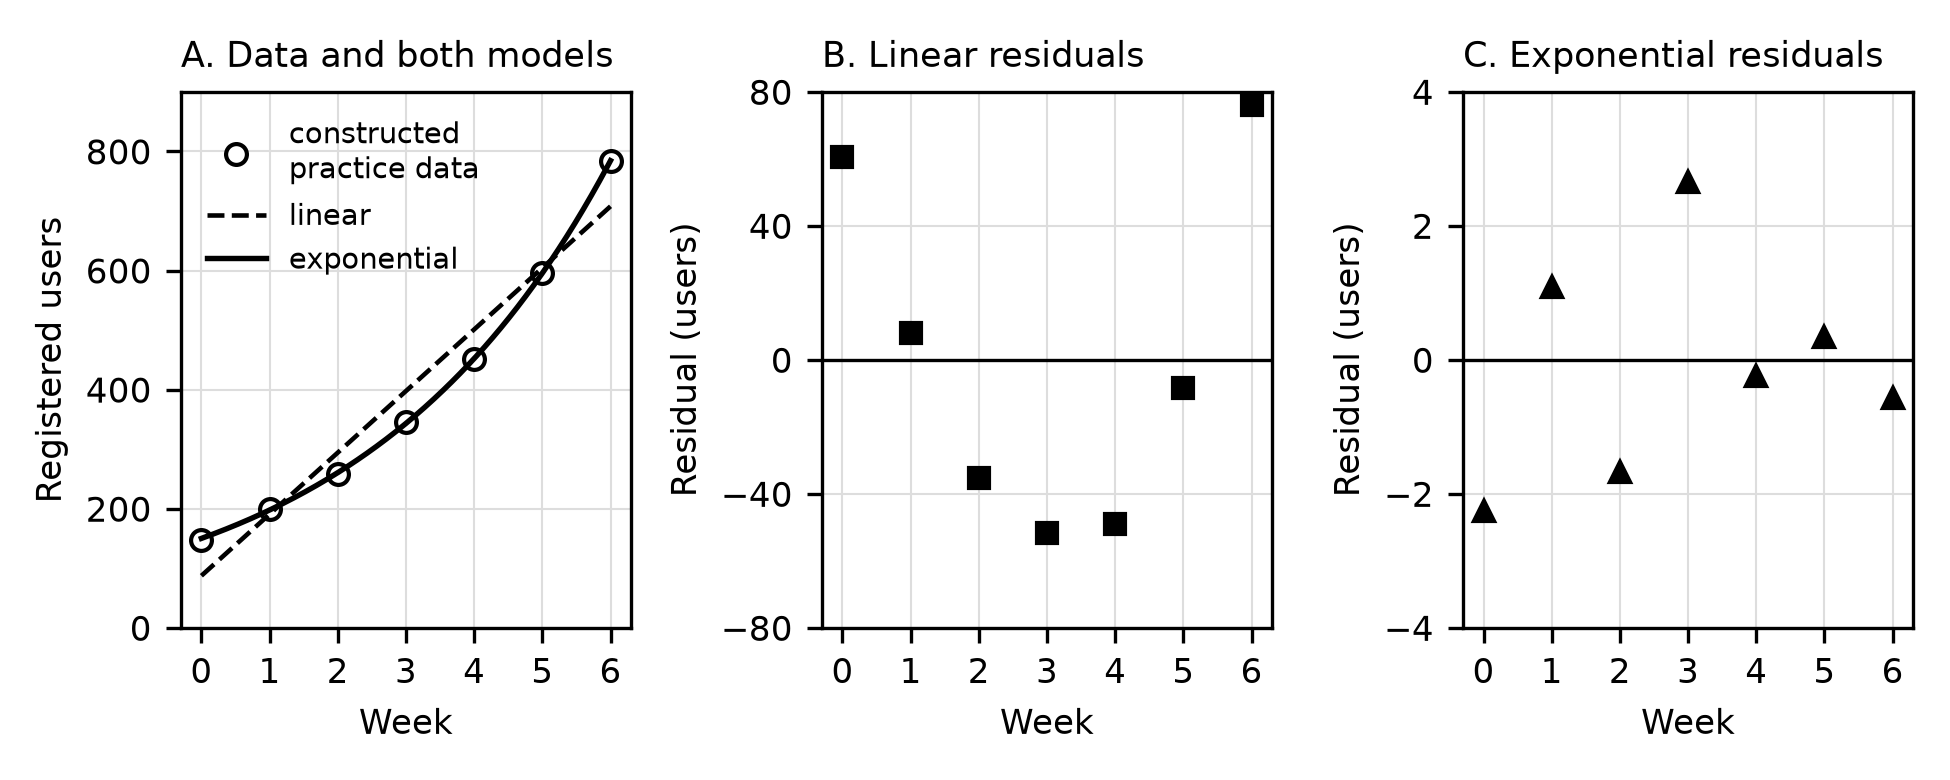
Figure 18.3. Constructed practice data with linear and exponential regressions. Panels B and C use different vertical scales.
Work without the calculator when it is not permitted
Parts I-A and II-B allow no calculator. The course description expects you to find zeros, solve equations and calculate values without technology whenever precalculus algebra can do it. Expect exact work: solve by writing , so ; solve on with the unit circle, giving and . A decimal such as 3.665 is not an exact answer.
In study, attempt every no-calculator item by hand first and use a calculator afterward only as a check. If they disagree, find the faulty step rather than accepting the decimal.
Try it
Try it 18.1. A student types and gets 0.035. What went wrong, and what is the correct value?
Try it 18.2. Let . A window from −10 to 10 shows two zeros. Explain how you know there is another, then find all zeros to three decimal places.
Try it 18.3. Solve with a calculator. A classmate reports two solutions. Which do you keep, and why?
Try it 18.4. A linear model's residuals for weeks 1 to 6 are 4, 1, −2, −3, −1 and 3. (a) At week 4, did the model overestimate or underestimate? (b) What does the pattern suggest?
Check your try-it work
18.1. The calculator was in degree mode: . In radians, . Exam calculator work uses radians.
18.2. , but with a positive leading coefficient, becomes negative as decreases without bound. Another zero therefore lies below −10. A window such as and shows all three: , and . A cubic has at most three, so the list is complete.
18.3. The domain requires . Graphing the original sum against gives . The other value, , comes from the combined form ; it makes both original arguments negative, so reject it.
18.4. (a) The week 4 residual is −3, and residual means actual minus predicted, so the prediction was 3 too high: an overestimate. (b) Positive, then negative, then positive residuals form a curve. The line misses systematically, so try a curved family and check its residuals.
Practice
Chapter 18 has no numbered questions. Its practice is Try it 18.1 to 18.4, with solutions under "Check your try-it work." Then rework Demonstrations 18.1 and 18.3 on your own calculator without looking, and log any step you could not reproduce. Calculator questions in Chapters 3 to 17 and both practice exams apply this workflow; their explanations are in Answers, explanations and written responses.
Review later
- Next session: from memory, write the five steps and one thing a calculator output cannot establish.
- In one week: redo Try it 18.2 and 18.3 without the solutions.
- Before Practice Exam A: confirm radian mode on every device you will use.